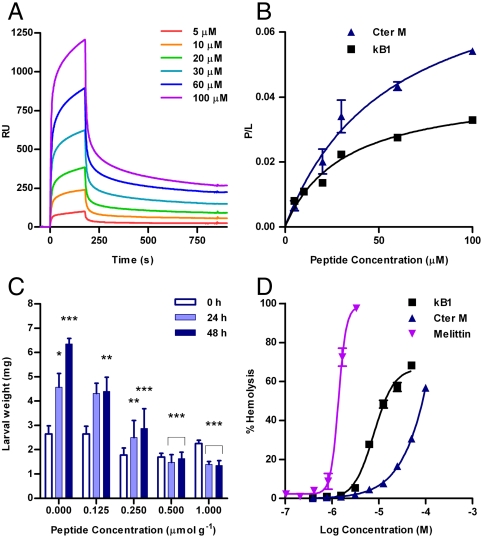
Fig. 4.
Biological and biophysical data for cyclotides. (A) Sensorgram for Cter M binding to immobilized POPC vesicles. Peptide samples were injected from 0 to 180 s; otherwise buffer was flowing. (B) Equilibrium binding curves for Cter M and kB1 binding to immobilized lipid vesicles. Fit to the single site binding model is shown as a solid line. (C) The weight of larvae at 0, 24, and 48 h is plotted versus Cter M concentration. Statistical differences were analyzed using a paired t-test for control growth and two way ANOVA for cyclotide treated growth values: *p < 0.05, **p < 0.01, ***p < 0.001. For control larvae, the weight at 24 and 48 h was compared to that at the start of the assay. For Cter M-treated larvae, the weight was compared to control larvae at the same time in the assay period. (D) Hemolytic activity of Cter M, kB1, and melittin from bee venom; HD50 was 1.4 μM for melittin, 7.8 μM for kB1 and > 100 μM for Cter M.

