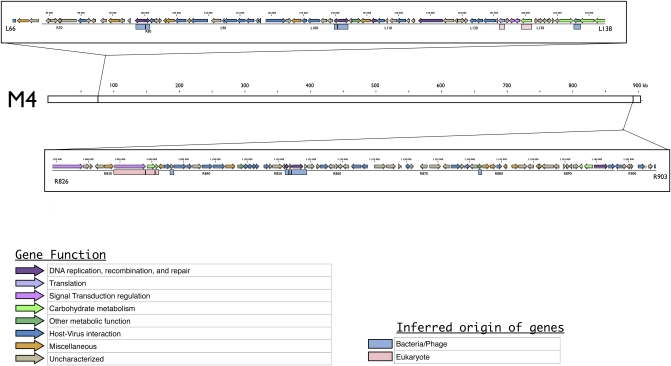
Fig. 3.
Genetic map of the two regions deleted at both ends of the M4 genome. The M4 genome is represented by a white box and its coordinates are indicated in kilobases. The two frames indicate the two regions deleted from the M1 virus. These are represented by genetic maps, including colored arrows representing CDS according to their putative function and colored boxes representing the phylogenetic origin of each gene inferred from previous phylogenetic analyses (9).

