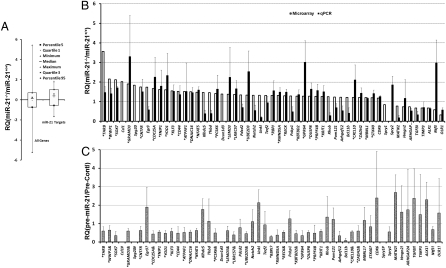
Fig. 5.
Expression of miR-21 targets in wild-type and miR-21-null keratinocytes. (A) The expression levels of miR-21 targets in wild-type and miR-21-null cells as determined by the microarray assay. A Whisker-box plot is presented with 5th, 95th percentile values as well as minimum, maximum, median, and 25th and 75th percentiles. The average values of all genes is 0.071, compared to 0.35 for miR-21 targets (P = 4.8E-05). RQ, Relative quantity of mRNA levels (Y axis) is reflected by the log 2 value of signal intensity (log 2(SDmiR-21-null-SDwild type). (B) The expression of miR-21 targets as determined by the qPCR assay compared to that by the microarray assay. (C) The expression of miR-21 targets in miR-21-null cells transfected with pre-miR-21. For B and C, RQ of mRNA levels (Y axis) is reflected by the log 2 value of signal intensity (log 2(SDmiR-21-null-SDwild type) normalized to that of Gapdh. Gene name in capital denotes that there is concordance between microarray and qPCR. “*” prefix, genes are down-regulated in miR-21-null cells when introduced with pre-miR-21. “&” postfix, UTR was confirmed to be down-regulated in a reporter assay; “#”, UTR down-regulated by no qPCR data; “?” UTR not down-regulated; “!”, UTR down-regulated but expression repression by miR-21 not supported by microarray or qPCR.

