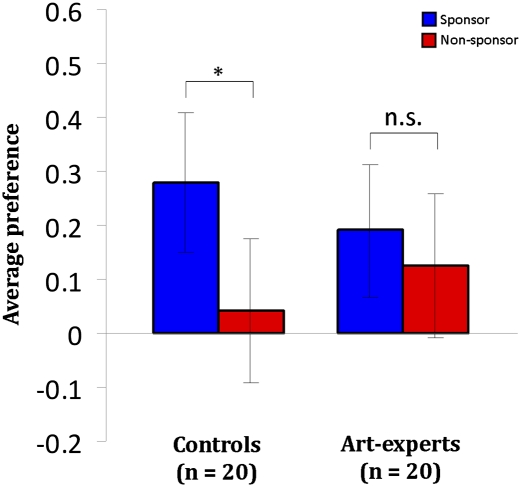
Fig. 2.
Average preference responses across groups collected postscanning. Global average preference responses grouped into sponsoring (blue bars) and nonsponsoring (red bars) conditions presented separate for each of the two groups (controls and art-experts). The rating scale was a Likert-type scale (+3 to −3). Statistical analysis showed a significant difference between sponsor and nonsponsor conditions for controls (n = 20), which is denoted with an asterisk, but not for experts (n = 20). Error bars represent SE.

