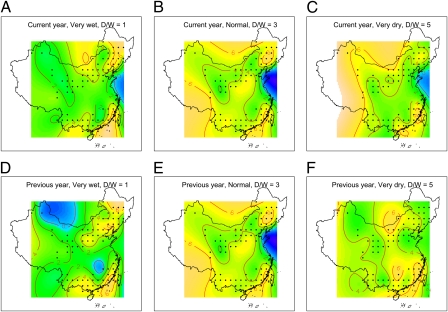
Fig. 3.
Predicted plague intensity of human plague cases from model B covering both northern and southern China under very wet, normal, and very dry conditions in the current year (A–C) and previous year (D–F). The color gradient represents predicted log-transformed plague intensity ranging from yellow (strong) to blue (weak). Points show the center grids of plague-infected area. Contour lines represent log- transformed predicted plague intensity equal to 0, 2, 4, and 6.

