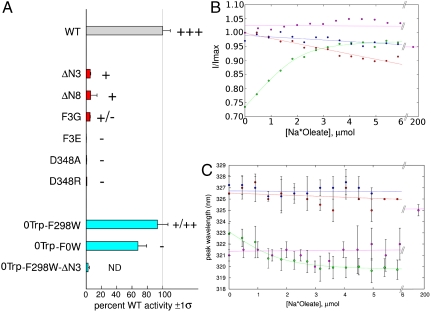
Fig. 2.
Oleate transport and binding by FadL proteins. (A) In vivo [3H]-oleate transport activities of wild-type (gray bar) and mutant EcFadL proteins, grouped by color (N-terminal mutants, red; 0Trp and single-Trp mutants, cyan). The weighted average and sigma values of moles oleate transported/(nanogram × min ) are reported as % wild-type, and obtained as previously reported (7). The zero-Trp mutant is labeled 0Trp-F0W for consistency. The gray vertical line marks 100% wild-type activity. Palmitate plate growth is graded in order “-” (no growth), “+,” “++,” and “++ +” (wild-type). ND, not determined. For more information, see Figs. S6–S9. (B and C) In vitro oleate and LDAO binding to EcFadL mutants monitored by intrinsic fluorescence. Green, 0Trp-F298W (oleate); magenta, 0Trp-F298W (LDAO); blue, 0Trp-F298W-ΔN3 (oleate); red, 0Trp-F0W (oleate). (B) Normalized fluorescence emission intensity at 319 nm vs. oleate concentration. (C) Peak emission wavelength vs. oleate/LDAO concentration. A quadratic fit is plotted for oleate titration to 0Trp-F298W in B and C. Note the extended concentration range for the LDAO titration. For oleate it is not possible to perform titrations > 10 μM due to Rayleigh scattering effects.

