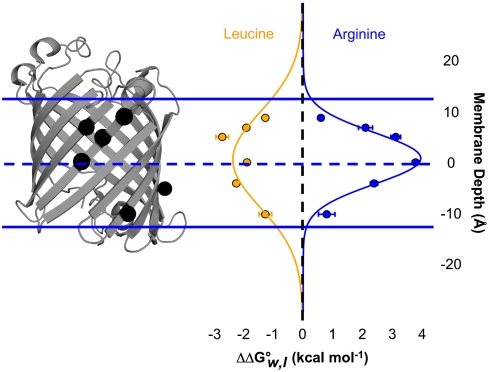
Fig. 3.
Energetics of side-chain partitioning varies by depth in the membrane. The OmpLA host-guest system is shown similarly as in Fig. 1 with the α-carbons of sequence positions 120, 164, 210, 212, 214, and 223 shown as black spheres. The membrane depth of those five α-carbons versus the  of leucine and arginine variants (compared to alanine variants) is shown aligned with the OmpLA image. Normal distributions fit to the leucine and arginine data are also shown. Error bars represent standard errors of the mean from individual titration experiments.

