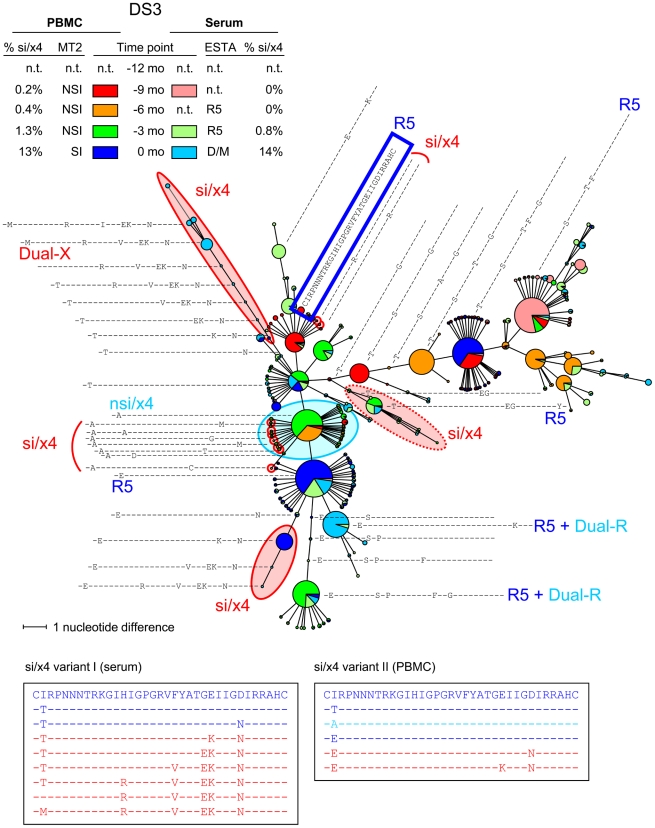
Figure 5. Multiple si/x4 variants emerge in subject DS3.
An MST of all V3 sequences generated from PBMC and serum samples of all time points is shown. See the legend to Figure 3 for details regarding the layout of the figure. Nodes containing V3 sequences with an si phenotype as inferred by PSSMNSI/SI and an x4 phenotype as inferred by geno2pheno[coreceptor] are indicated in red, nodes containing discordant nsi/x4 variants are indicated in light blue, while all other sequences were predicted to be nsi/r5. Two distinct si/x4 branches and several minor si/x4 variants can be observed in this MST, which are described in more detail in the text. In addition, one branch contains V3 sequences with a predicted si/x4 phenotype which were reported R5 in the Trofile assay (indicated by dotted red oval). N.t., not tested; mo, months.

