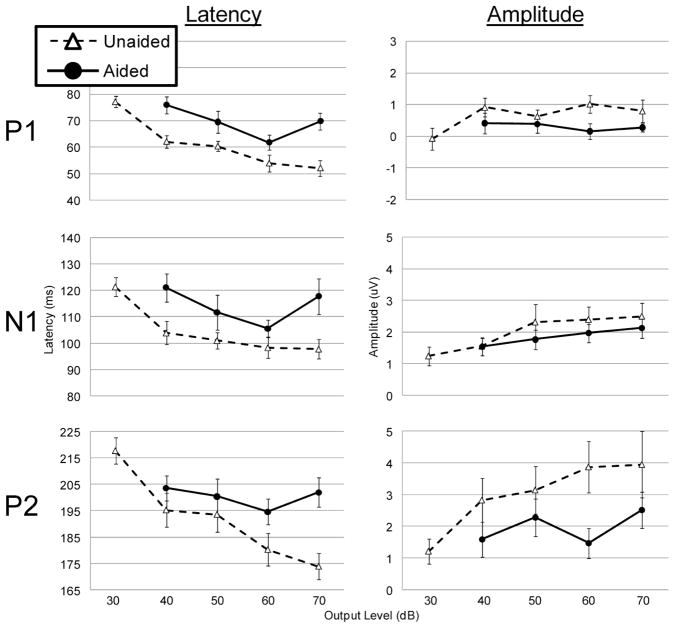
Figure 2.
Output level growth functions at electrode Cz for P1, N1, and P2 waves. Latency (left) and amplitude (right) measures are displayed for the aided (solid line, filled circles) and unaided (dotted line, open triangles) conditions. Error bars represent 1 standard error of the mean. In the unaided conditions, latencies decrease as the stimulus level increases. Aided response show a similar function except at the highest stimulus level. Most important is the difference between unaided and aided responses despite similar signal levels being present in the ear canal.

