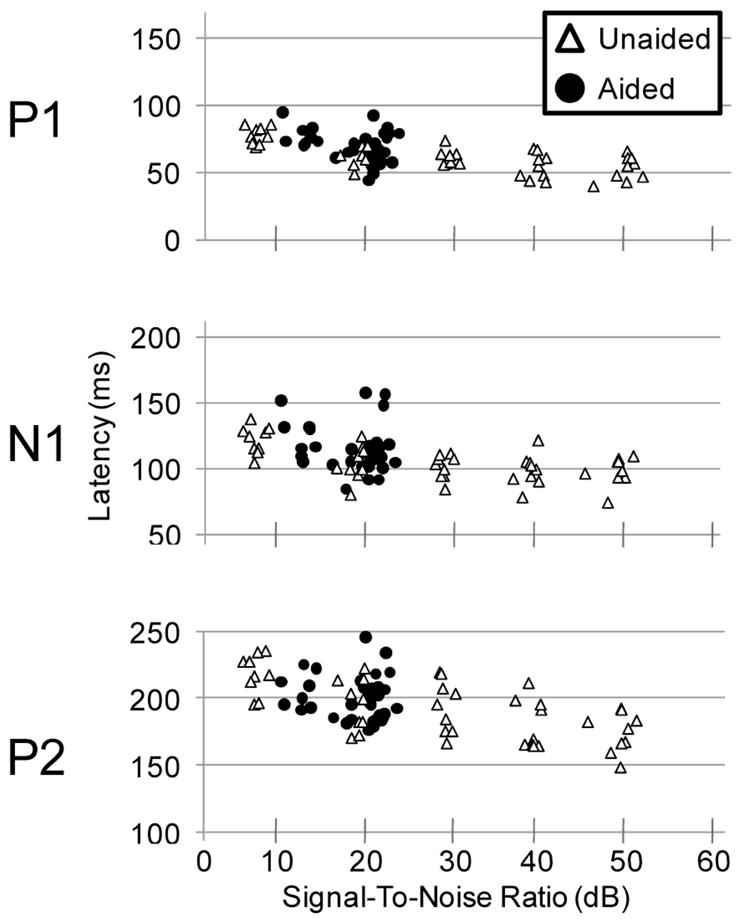
Figure 5.

Scatter plots of P1, N1, and P2 latency taken from Cz and plotted as a function of SNR. Data for the nine participants demonstrate that as SNR increases, latency decreases. Also note the wide range of unaided SNRs (open triangles) in contrast to the limited range of aided SNRs (filled circles). Therefore, these aided CAEPs do not differ across hearing aid gain settings, because SNR is similar across the different gain conditions.
