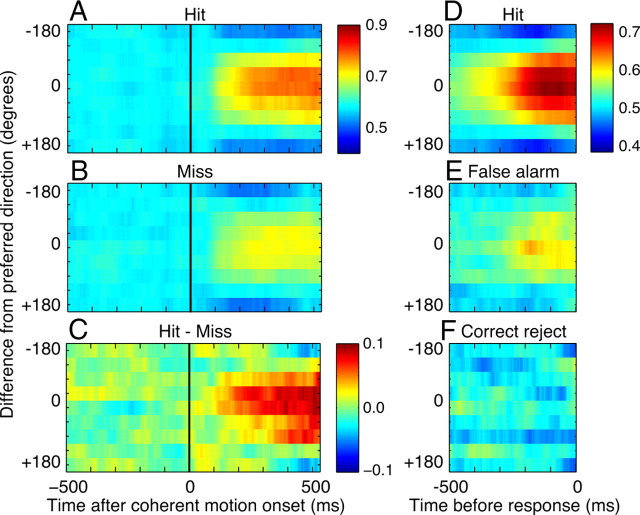
Figure 2.
Relationship of average normalized firing rates to behavior. A, Average normalized response on trials with correct detections (Hit). For each neuron, responses were aligned to the onset of motion coherence, and then trials with different directions were averaged separately and normalized to the overall peak response during a 1 s period centered on motion coherence onset. There was a prominent, direction-selective response shortly after the onset of motion coherence. B, Corresponding data for miss trials, using the same scale as in A. C, Difference between the average responses on hit and miss trials, normalized for each neuron to the overall peak response. D, Average normalized response on trials with correct detections. Data and analysis as in A but after aligning trials on the animal's response. E, Average normalized response on false alarm trials, using the same scale as in D. F, Average normalized responses to periods without coherent motion that the animal did not respond to (Correct reject). Epochs were drawn from correctly completed trials using times before the onset of coherent motion that had exactly the same distribution as the trials in E. Same scale as in D and E.

