
Figure 3.
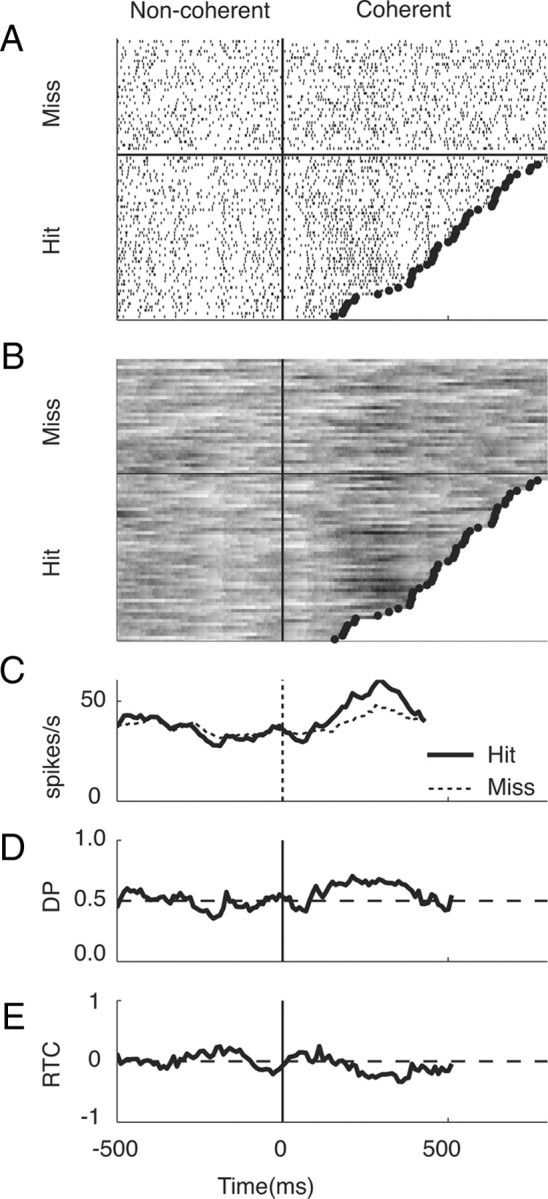
Responses from one cell for the preferred direction of motion. A, Spike rasters for all trials for the preferred direction sorted according to whether the animal correctly detected (hit) or failed to detect (miss) the coherent motion. Trials are aligned by the onset of coherent motion, which is at time 0. Reaction times on correct trials are shown by the filled circles. Tick marks indicate the occurrence of a single spike. Spikes beyond the reaction time are not shown and were not included in any analyses. B, Filtered spike data. The raster in A has been filtered with an exponential filter with a time constant of 100 ms. C, Average firing rate on hit (thick line) and missed (thin line) trials. Both traces are truncated at the median reaction time. D, Time course of detect probability. An ROC analysis was performed on the filtered firing rate distributions for hit and missed trials at 10 ms intervals from 500 ms before onset of coherent motion. E, Time course of reaction time correlation.