
Figure 6.
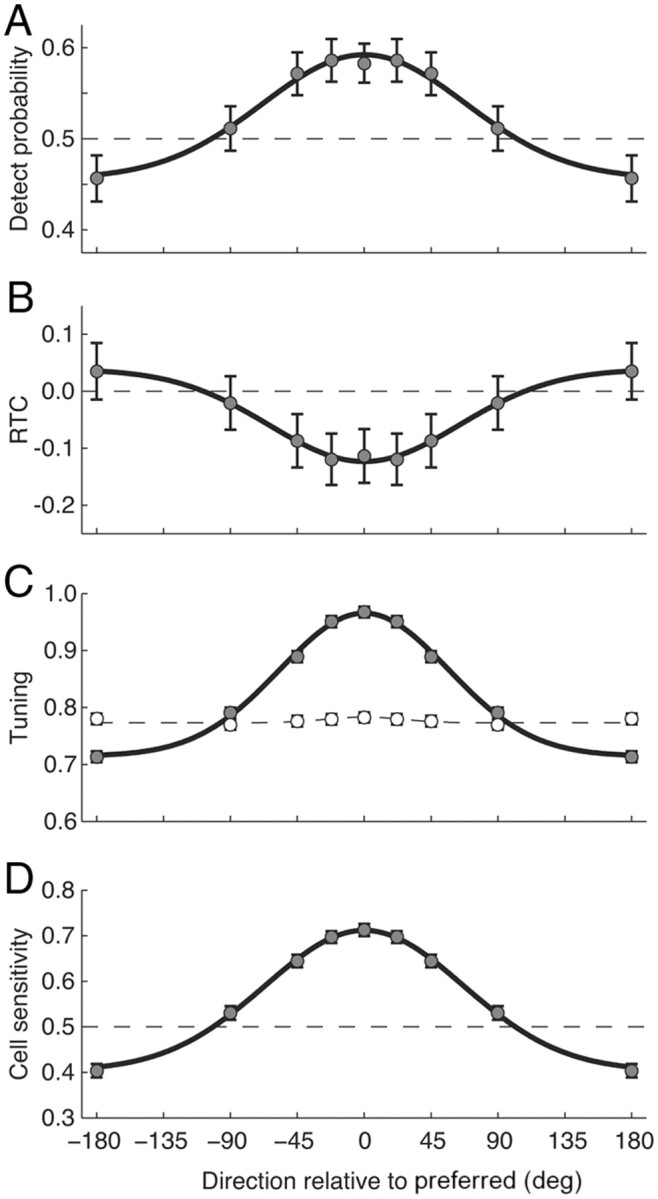
Tuning of neuronal measures. A, Tuning of DP relative to difference from the preferred direction. Data points indicate the mean for each direction bin calculated at 400–500 ms into the coherent motion. Error bars are 95% confidence intervals. The solid line is the best fitting Gaussian (σ = 75°). B, Tuning of RTC correlation at 200–300 ms into the coherent motion period. Same format as A. The σ of the fitted Gaussian was 58°. C, Average normalized responses to random dot motion that was noncoherent (open symbols) and weakly coherent (filled symbols). The dashed and solid lines are the best-fitting Gaussians (σ for coherent motion = 60°). D, Average sensitivity of neurons to different directions of motion, based on an ROC analysis comparing activity before and after the onset of coherent motion. The σ of the fitted Gaussian is 71°.