
Figure 7.
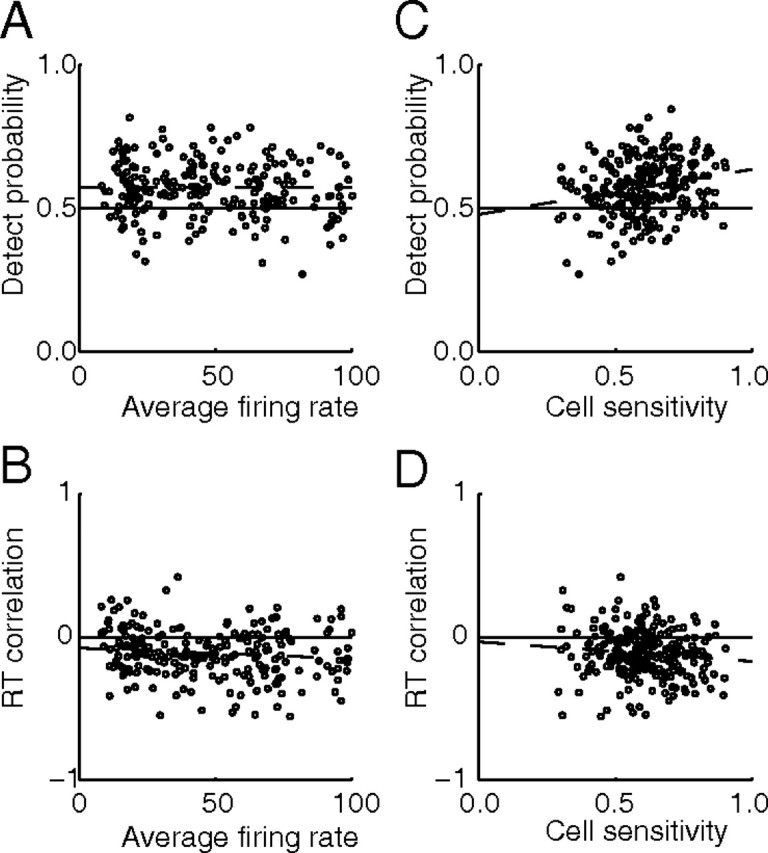
The effect of firing rate and cell performance on DP and RTC. Only trials with coherent motion within 45° of the preferred direction are included. Each cell can contribute up to five points to each plot. DP values were obtained based on activity 400–500 ms after the onset of coherent motion. RTC values were obtained based on activity 200–300 ms after onset of coherent motion. A, DP versus average firing rate (r = 0.00, p = 0.98, slope = 0.00001). B, RTC versus firing rate. A weak trend is observed for RTC to vary by firing rate (r = 0.13, p = 0.04, slope = −0.0007/°). C, DP versus cell performance. Cell performance is measured by an ROC analysis of the firing rate obtained in response to the noncoherent motion versus the firing obtained for the coherent motion. A small but significant trend is observed for larger DP for cells that had better detection performance (r = 0.22, p = 0.001, slope = 0.16). D, RTC versus cell detection performance. Again a weak trend is observed for RTC to depend on cell performance (r = 0.11, p = 0.10, slope = −0.14).