An official website of the United States government
Here's how you know
Official websites use .gov
A
.gov website belongs to an official
government organization in the United States.
Secure .gov websites use HTTPS
A lock (
) or https:// means you've safely
connected to the .gov website. Share sensitive
information only on official, secure websites.

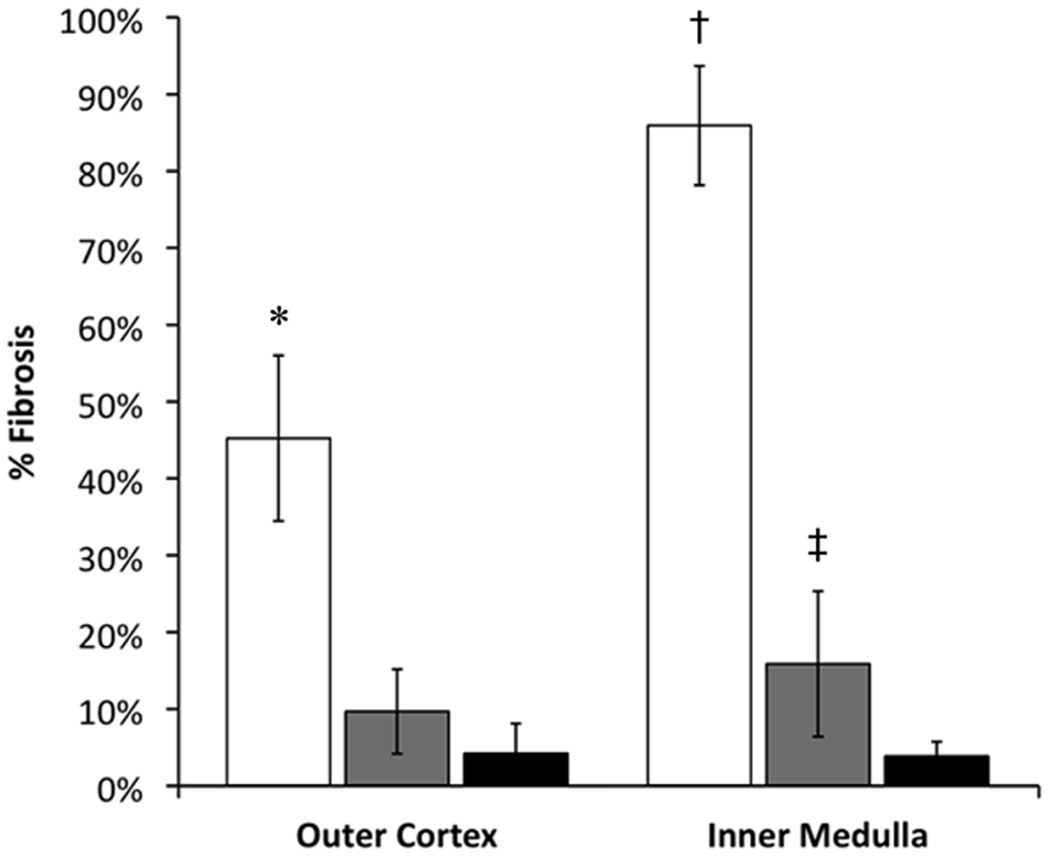
 ) groups as graded by ultrasound. Fibrosis was scored in multiple fields for each kidney and the mean scores compared to controls (■). *p = 9 × 10⁻⁷; †p = 4 × 10⁻⁸; ‡p = 0.04.