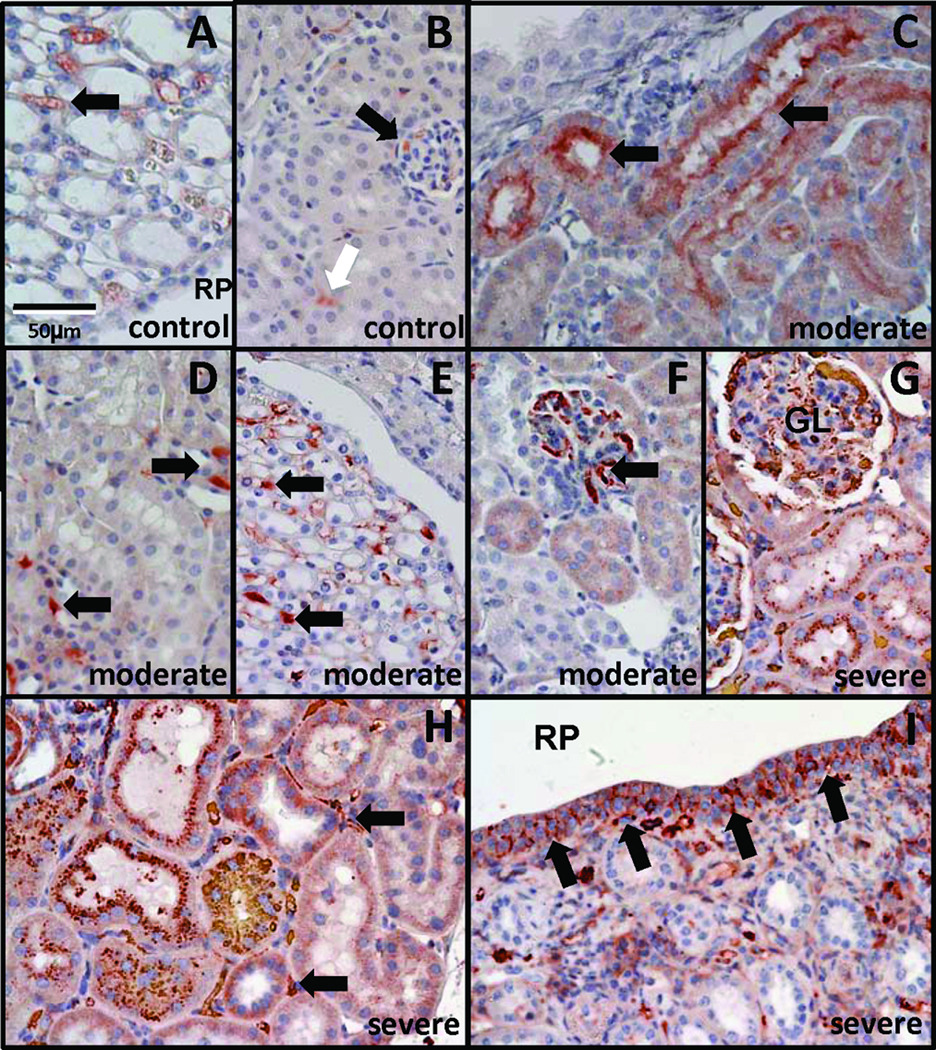
Figure 8.
TGFβ1 expression in AD kidneys. Control kidneys show TGFβ1 staining in interstitium of renal papilla (A, arrow) and cortex (B, white arrow), and glomeruli (B, black arrow). Moderate mgb−/− kidneys show expanded TGFβ1 staining within medullary tubules (C, arrows), cortical and medullary interstitial cells (D,E, arrows), and glomeruli (F, arrow). Severe mgb−/− kidneys show expanded TGFβ1 staining in cortical tubules (G), glomeruli (G, GL), medulla (H), interstitial cells (H, arrows), and renal pelvis (RP) urothelium (I, arrows). 40X.

