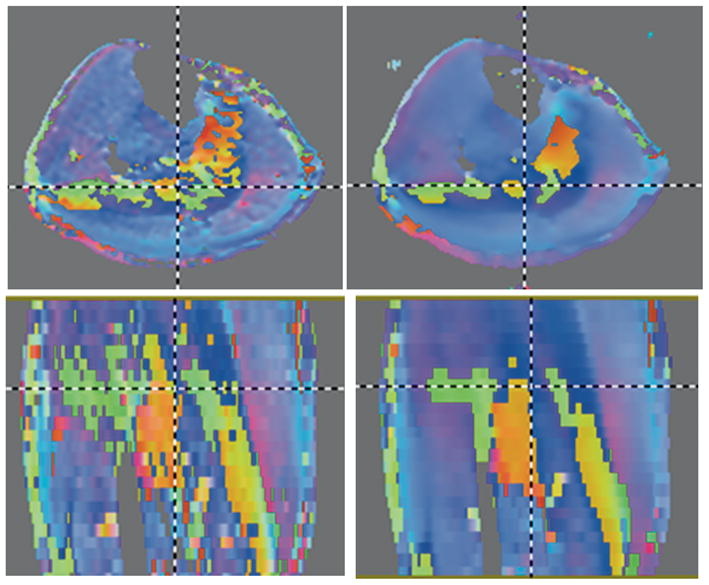
Figure 1.

Axial (top row) and coronal (bottom row) images of the color map of the lead eigenvector of the diffusion tensor from images acquired at plantarflexion Left column: prior to denoising and right column: corresponding after tensor denoising. The effect of tensor denoising on reducing noise in the lead eigenvector can be readily appreciated. Further, the smoothing algorithm preserves the boundaries between muscle regions. The color map is encoded as: Superior to Inferior: Blue; Right to Left: Red; and Anterior to Posterior: Green. Unsuppressed fat shows as regions around the muscle but was easily avoided in ROI measurements since the fat signal was very much reduced compared to muscle in the b0 images and could be readily identified. The fat was not thresholded during tensor fitting in order to ensure that small low intensity regions in the muscle were not inadvertently thresholded.
