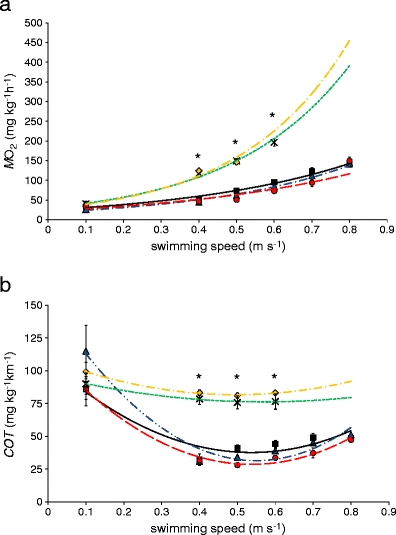
Fig. 1.

Effect of pop-up satellite tags on a oxygen consumption (in milligram O2 per kilogram per hour) and b cost of transport (in milligram O2 per kilogram per kilometer) for swimming 1 kg European eels (n = 8). Treatment levels were: no tag, before operation (filled square, black); no tag, after operation (filled triangle, blue), with positive buoyant tag (multiplication sign, green); with neutral buoyant tag (filled diamond, orange); no tag, final test (filled circle, red). All data are mean ± SE. Data were compared using repeated measures ANOVA. Asterisk indicates significant difference from control at P < 0.05
