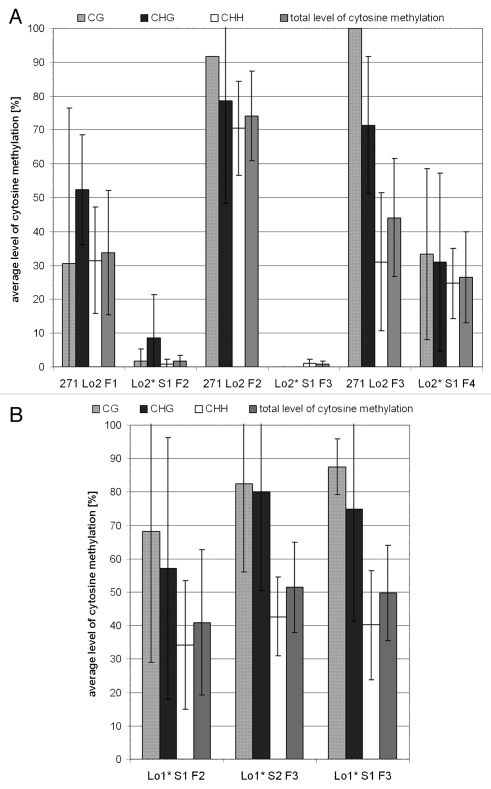
Figure 5.
Analysis of the 35S promoter methylation in the parental hybrids and derived segregants by bisulfite genomic sequencing. (A) Summary of cytosine methylation levels in 271 Lo2 hybrids (F1–F3) and derived segregants with the “-/Lo2” genotype. The analyzed 344 bp region comprise both core promoter (−1/−46) and enhancer sequences at −46/−105.51 The diagram is organized to show the methylation pattern in the parent the first followed by that of the segregant (S1). [BR2]The data are averaged values from 4–6 clones per sample. Variation in methylation density between the clones is indicated by error bars (standard deviation). (B) Summary of cytosine methylation levels in segregating progenies from the 271 Lo1 line (“-/Lo1” genotype).

