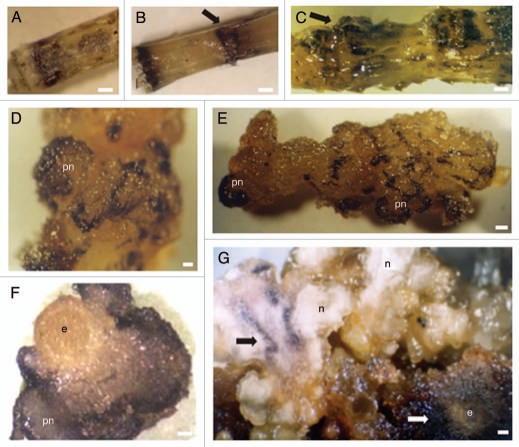
Figure 9.
Tissue specific distribution of ROS following staining with NBT (A–E and G) and DAB (F). (A) Internode at the time of excision from the parent plant. Dark purple spots identifying ROS are seen. (B) Internode 24 hours upon wounding showing intense NBT staining at the cutting regions. (C) Internode seven days upon wounding. Calli cells concentrated in previously wounded areas show intense NBT staining (arrow). (D) Aspect of a prenodule (pn) arising 15 days upon internodes inoculation showing cells stained dark purple. (E) Internode 15 days upon wounding showing prenodules with intense accumulation of ROS. (F) Internode section showing a prenodule stained with DAB. (G) Cluster of nodules (n) 45 days after internodes inoculation. Initial explant (e) has proliferated giving rise to calli cells which appeared intensively stained (white arrow). Bars in A–C and F = 0.6 cm. Bar in E = 0.3 cm. Bars in F and G = 0.5 cm.

