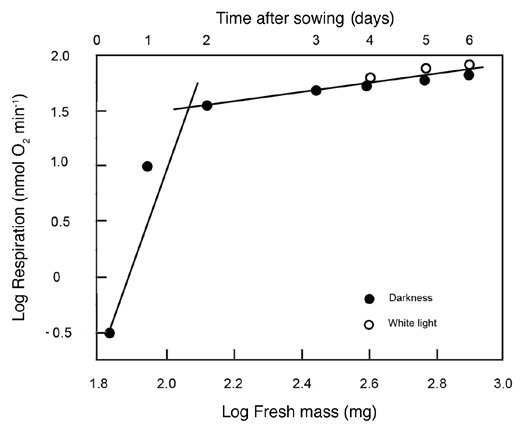
Figure 2.

Bivariate plot of log10-transformed data for cellular respiration (R) versus fresh mass (Mf) during germination and seedling development. Sunflower seeds were raised in the dark or, after 3 days of plant growth, irradiated with continuous white light (WL). Lines are reduced major axis (RMA) regression curves (summary statistics provided in the text).
