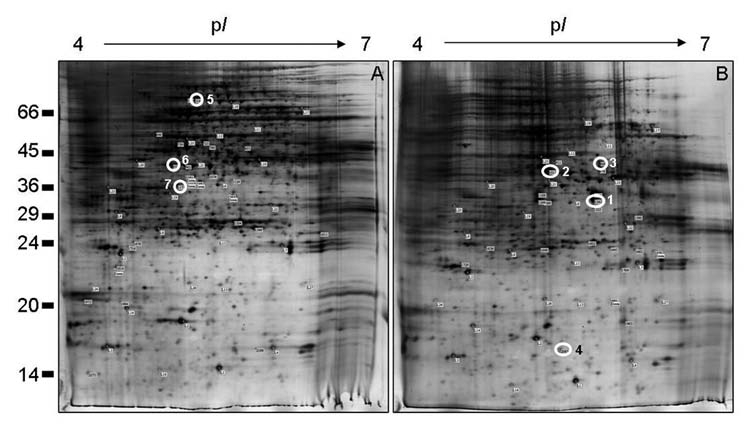
Figure 1.

2-D resolution of the maize cultured cells proteins. Comparison of the total proteins of non-habituated (A) and DC B-habituated (B) maize cells. Numbers on the left indicate the positions of the relative molecular mass standards (X1,000 Da), and the isoelectric point (pI) is given at the top. Gels were loaded with 200 µg proteins and visualized by silver staining. The open white circles correspond to the selected spots analyzed by MALDI-TOF/MS or by LC-nanoESI-Q-TOF-MS/MS, which are listed in Table 1.
