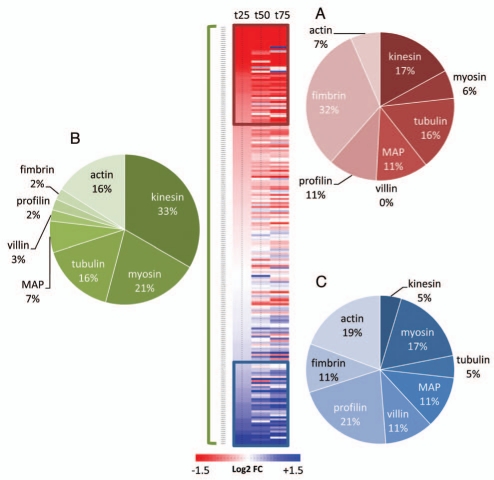
Figure 2.
Analysis of transcript abundance of genes encoding cytoskeleton-related proteins during natural senescence. Fold changes (from extracted data15) are expressed as the log2 of the ratio between t25 t50 or t75 and t0. 207 genes were hierarchically clustered and 2 subclusters were defined with genes that were consistently down (red) or up (blue) regulated. The pie diagrams represent the percentage distribution of gene families within the subclusters of downregulated genes (A), of upregulated genes (C) and within the entire subset of genes covered by this study (B).

