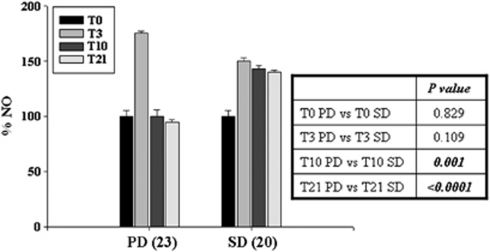
Figure 3.
Modulation of serum levels of NO. Variations of NO serum levels in 23 patients resistant to treatment (PD) and 20 patients responsive to the treatment (SD) enrolled in the So.LAR study, using an enzyme spectrophotometric assay as described in ‘Materials and Methods'. T0, T3, T10 and T21 indicate the measurement performed before the treatment, and after 3 days, 10 days and 21 days from the beginning of the schedule, respectively. Bars, S.D.s. Inset, table representing the P-values and the statistical significance of the changes of the different values

