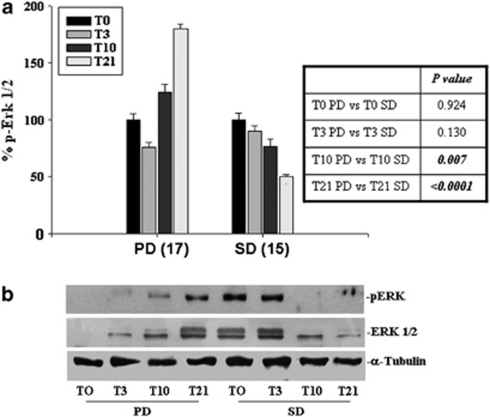
Figure 4.
Modulation of Erk1/2 activity. PBMC of 17 patients resistant to treatment (PD) and 15 patients responsive to the treatment (SD) enrolled in the So.LAR study were processed for the evaluation of the intracytoplasmic expression of Erk 1/2 activity. (a) Representation of the percentage of pERK1/2 levels compared with PBMC labeled with a specific antibody obtained by cytofluorimetric analysis of indirectly-labeled PBMC of 32 patients. (b) Detection of phosphorylation levels of Erk1/2 evaluated by western blot analysis as described in ‘Materials and Methods'. T0, T3, T10 and T21 indicate the measurement performed before the treatment, and after 3 days, 10 days and 21 days from the beginning of the schedule, respectively. Bars, S.D.s. Inset, table representing the P-values and the statistical significance of the changes of the different values

