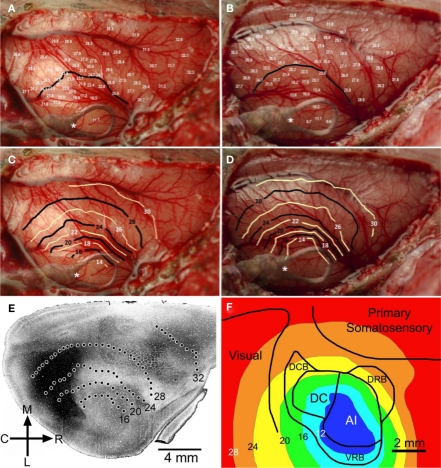
Figure 1.
Changes in cortical temperature. Temperature was sampled at multiple sites (>60) and depths (500, 1000, and 1500 μm) across auditory, visual, and somatosensory regions of cortex. The temperature measurements taken at 500 μm for two GPs #1082 and GP#1084 are shown in (A) and (B), along with 24°C contour lines generated for each animal. Contour plots were generated for each GP, shown in (C) and (D), at 500 μm demonstrating the spread of cooling through cortical tissue. The position of the cooling loop was superimposed on each of these images and the position of the thermocouple monitoring cooling loop temperature was marked (*). (E) Cooling contours from the first GP [shown in (A) and (C)] were overlaid on an image showing regional boundaries delineated by shading based on cytochrome oxidase staining (from Wallace et al., 2000). (F) Cooling contours from the second GP [shown in (B) and (D)] were overlaid on a schematic showing boundaries of auditory, somatosensory, and visual cortices.

