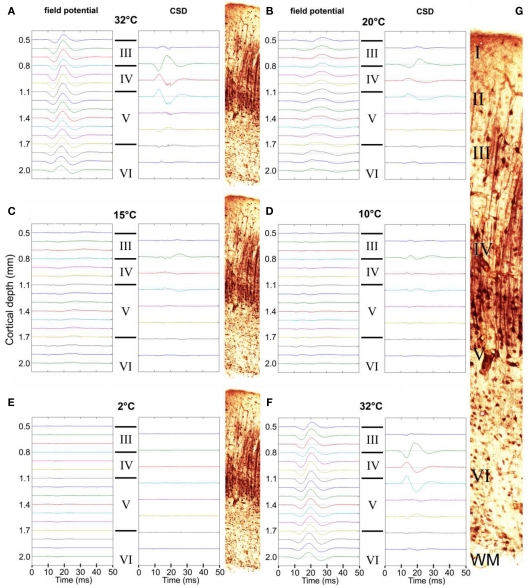
Figure 2.
Auditory-evoked local field potential activity in auditory cortex. Representative averaged field potentials recorded simultaneously at 16 sites are shown at a series of progressively decreasing temperatures: 32°C (A), 20°C (B), 15°C (C), 10°C (D), and 2°C (E), and again at 32°C (F) after a 20-min recovery period. Corresponding CSD plots are shown alongside. The approximate layer of each field potential recording/CSD is also indicated (III, IV, V, or VI) and illustrated by the thallium-labeled sections shown. (G) Enlarged thallium-labeled section indicating approximate layer delineations.

