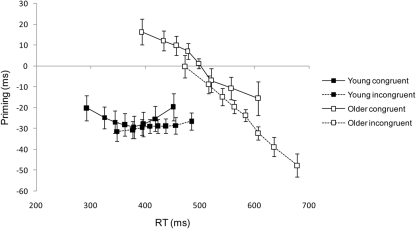
Figure 4.
Mean priming effects (incompatible – compatible RT) ± 1 SE in ms plotted as a function of mean response times (RTs) for each of eight RT latency bins from the time course analysis (see text for details). Data are plotted separately for young and older adults and for congruent and incongruent trials.

