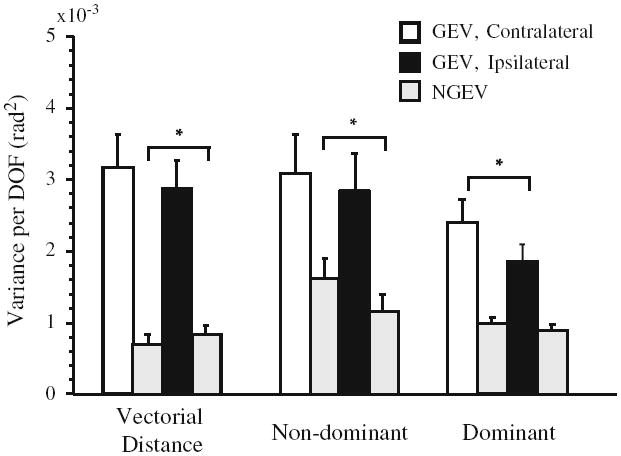
Fig. 7.

Mean components of joint configuration variance related to control of the vectorial distance between the hands, the nondominant and dominant hands’ paths. GEV is represented by open (contralateral) or black (ipsilateral) bars; NGEV for all control hypotheses is indicated by the light gray bar immediately to the right of the bars representing GEV. Error bars are SEM. *P < 0.05
