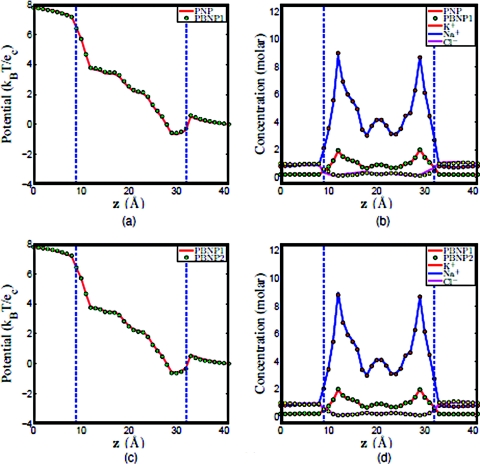
Figure 11.
Comparison of PNP, PBNP1, and PBNP2 models with V0=200 mV , n0=1.0 M, and K+:Na+ = 2:8. (a) Electrostatic potential profiles computed from PNP and PBNP1; (b) Concentration profiles computed from PNP and PBNP1; (c) electrostatic potential profiles computed from PBNP1 and PBNP2; (d) concentration profiles computed from PBNP1 and PBNP2.

