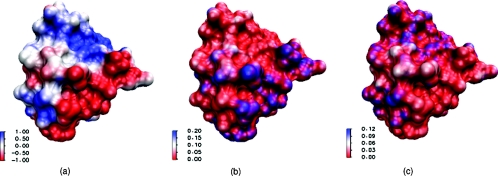
Figure 3.
Illustrations of computational results on the molecular surface of protein 451c. (a) Electrostatic potential profile; (b) concentration of positive ions; (c) concentration of negative ions. The unit of electrostatic potential is kBT/ec, and the unit of concentration is molar, here the blue color shows larger values while red color shows smaller values.

