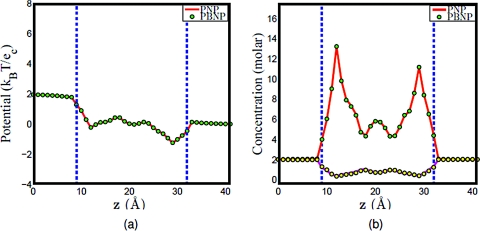
Figure 7.
Comparison of PNP and PBNP models with V0=50 mV and n0=2 M in the KCl mixture. (a) Electrostatic potential profiles; (b) concentration profiles, the solid lines (red and magenta) represent the concentration of K+ and Cl − in PNP computation, while the dots (green and yellow) represent the concentration of K+ and Cl − in PBNP computation.

