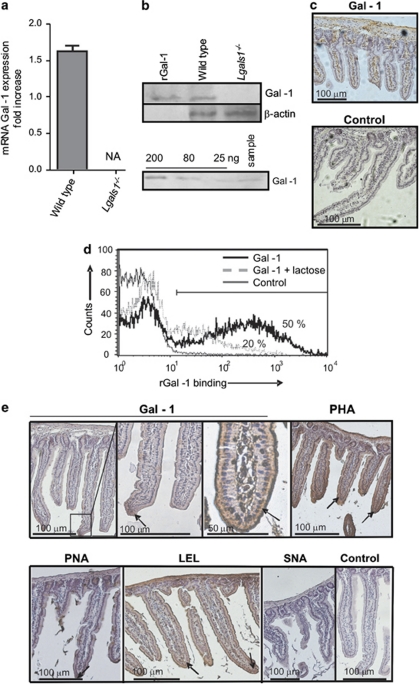
Figure 1.
Expression of Gal-1 and Gal-1-binding sites in small bowel mouse mucosa. (a) Quantitative RT-PCR analysis of mRNA Gal-1 expression in duodenum of wild-type and Lgals1−/− mice. Results are expressed as fold increase of mRNA Gal-1 expression, standardized with mRNA β-actin expression (NA: no amplification). (b) Upper panel: immunoblot analysis of protein extracts obtained from duodenum of wild-type and Lgals1−/− mice; lower panel: immunoblotting for Gal-1 of duodenum from wild-type mouse (sample) and known quantities of rGal-1 (200–25 ng) to build a standard curve for quantification of relative Gal-1 concentration in tissues analyzed. (c) Immunohistochemistry of Gal-1 in duodenum of wild-type mice as revealed with a rabbit Gal-1 antiserum or non-immune rabbit serum as negative control. (d) Flow cytometry of Gal-1 binding to isolated mouse enterocytes. Biotinylated rGal-1 and streptavidin-APC were used with (dotted lines) or without 100 mM lactose (black lines). As controls (gray lines) cells were only stained with streptavidin-APC. Percentages correspond to cells expresssing Gal-1-binding sites. (e) Glycophenotype of mouse duodenum was assayed using biotinylated lectins: Gal-1, PHA (as an indicator of β1,6-branched complex N-glycans), PNA (indicating lack of terminal α2-3-linked sialic acid in core-1-O-glycans), LEL (indicating poly-N-acetyl-lactosamine sequences), SNA (indicating the presence of α2-6 sialic acid linked to terminal galactose). Negative controls were carried out by omitting incubation with the corresponding lectin. Arrows indicate lectin binding

