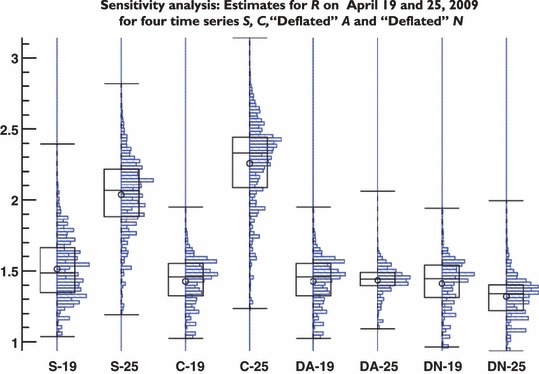
Figure 4.

Sensitivity analysis. We simultaneously varied all parameters depicted in Table 1. This figure shows the boxplots and the distribution of outcomes estimated using the time series from 1March to 19 April and the time series from 1 March to 25 April (near the peak). While the value of R is predominantly determined by transmission dynamics, there is a pronounced impact by external social forces on the estimation of R resulting in a higher value (and wider distribution). This effect can be corrected if instead of the raw data (four left panels), the adjusted time series are used (four right panels). For each panel, we used 388 080 different combinations of parameter values from Table 1.
