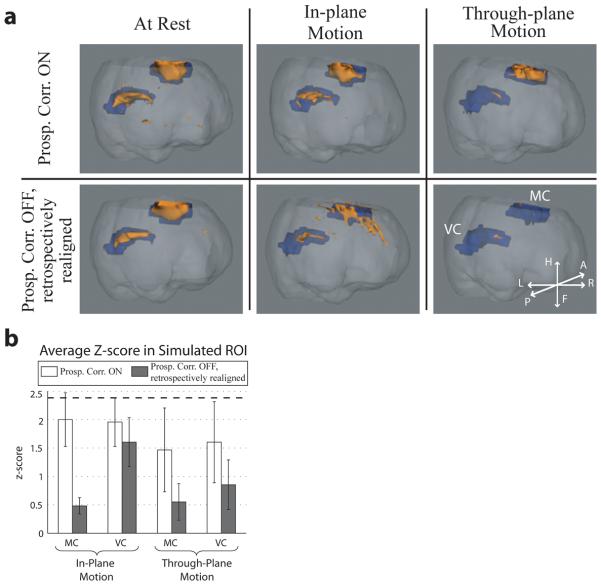
Fig. 4.
Analysis of the datasets from a BOLD fMRI perspective. a: Activation maps from one volunteer during resting (column 1), continuous in-plane (column 2), and through-plane (column 3) motions. Blue ROIs represent areas of the motor cortex (MC) and visual cortex (VC) where the BOLD signal was simulated, while orange ROIs denote areas of measured activation (p < 0.01) using the standard SPM5 fMRI package. Prospective correction (row 1) during deliberate motions shows an overall increase in true activation (orange within blue ROIs), and decrease in false activation (orange outside of blue ROIs) vs. retrospectively realigned scans (row 2). Orientation in the patient coordinate system is shown in the bottom-right inset. b: Summary of brain-activation sensitivity, as measured by the average z-scores within the stimulated MC and VC regions (blue ROIs), over all continuous-motion scans. For both in-plane and through-plane motions, each column represents the average z-score over the relevant volunteer scans, while error bars are standard deviations between scans. Comparing average z-scores, prospective correction outperforms conventional retrospective realignment for all conditions of deliberate motion, as expected from the σ̄ results in Fig. 3b. The greatest improvement of brain-activation sensitivity is seen in the MC during in-plane motion, and in both MC and VC during through-plane motion. The average z-score in the MC and VC over all resting scans = 2.48 (best-case scenario) and is depicted by the dashed line; no statistically significant difference was found between resting scans.

