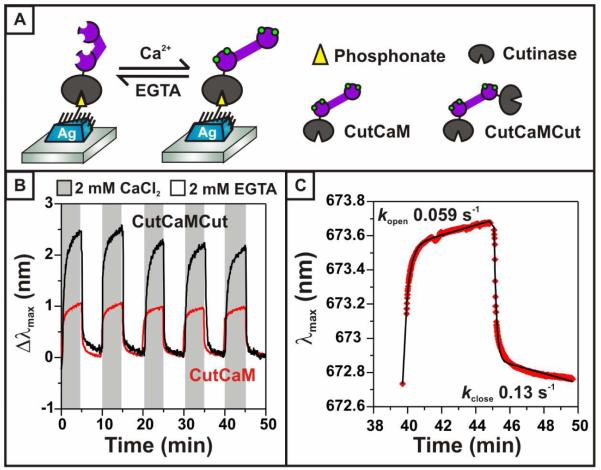
Figure 2.
CutCaM conformational changes. (A) Schematic representation of the reversible conformational changes calmodulin undergoes in response to changing calcium concentration. In the presence of calcium (green circles) calmodulin adopts a rigid, extended structure. (B) LSPR λmax changes plotted over time as calmodulin undergoes conformational changes. LSPR response to CutCaM is plotted in red; LSPR response to the larger CutCaMCut construct described in reference 21 is plotted in black as a comparison. (C) First order kinetic fit to the CutCaM-induced λmax changes occurring between 40 and 50 minutes from the plot in 2B. Rate constants for the opening and closing transitions were found to be 0.057 s−1 and 0.13 s−1, respectively.

