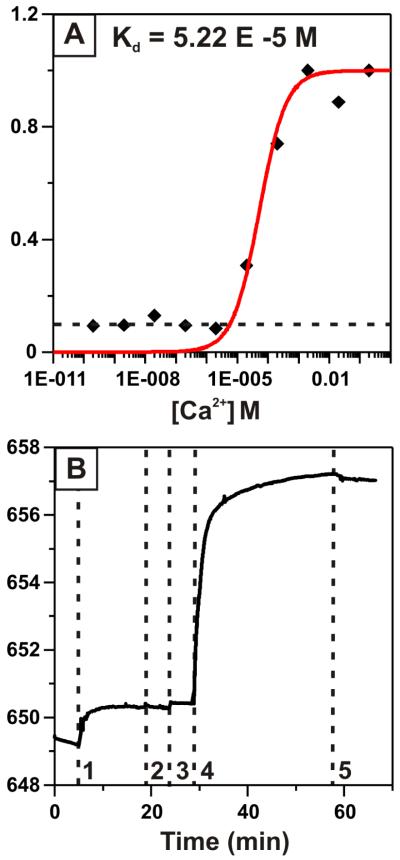
Figure 5.
LSPR detection of calcium ions and calmodulin-specific ligands. (A) Binding curve describing λmax response of the CutCaMCut functionalized LSPR sensor to varying calcium concentration. Data (black diamonds) is fit to a langmuir isotherm (red line) in order to determine Kd. The non-specific response of 0.1 nm due to bulk refractive index changes is depicted by the dashed black line. (B) Time trace depicting LSPR detection of anthrax edema factor (EF) binding to calmodulin. Dashed lines indicate exposure of the LSPR sensor to (1) 500 nM CutCaMCut, (2) 20 mM Tris, (3) 100 μM CaCl2, (4) 1 μM EF, and (5) 20 mM Tris.

