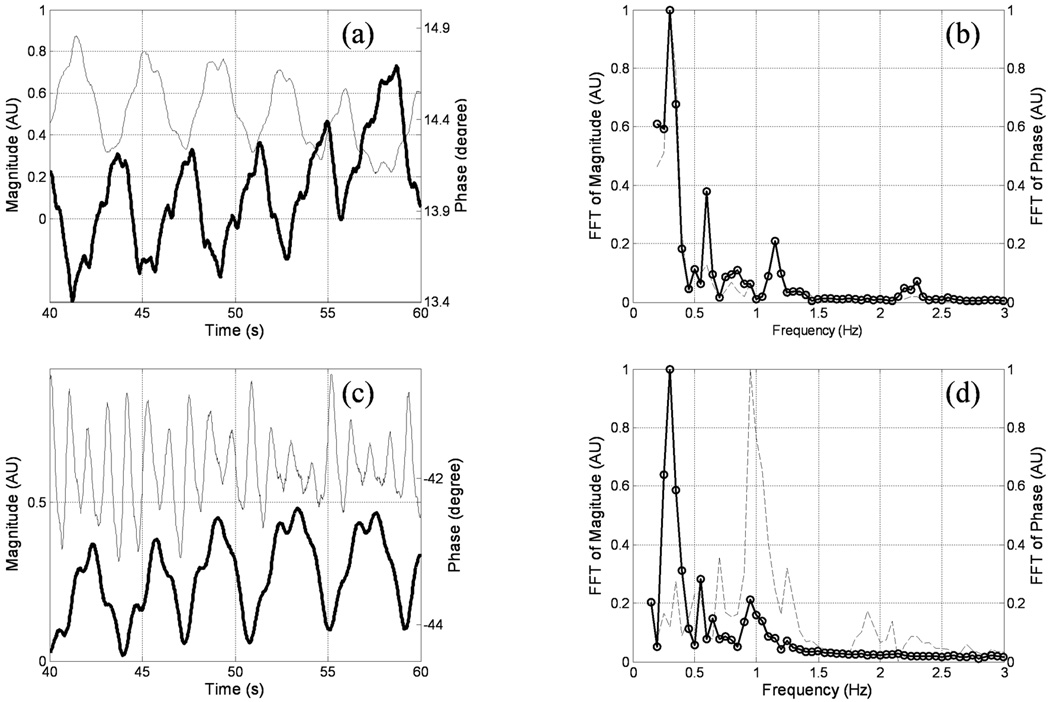
Figure 5.
Time evolution of signal magnitude and phase at the center of k-space acquired with the 2D UTE sequence during free breathing for subject 2 at 3.0T. (a) and (c) show the signal curves at TE = 0.03 and 0.7ms (phase in bold curves), respectively. (b) and (d) are the corresponding FFT curves in the frequency domain. At TE = 0.03, the respiratory cycle can be clearly observed in (b) as a peak around 0.25Hz in both magnitude (dotted curve) and phase (circled curve) spectra; while in (d) the respiratory cycle can only be observed in the phase spectrum. The peak near 1Hz in magnitude spectrum corresponds to the cardiac cycle.

