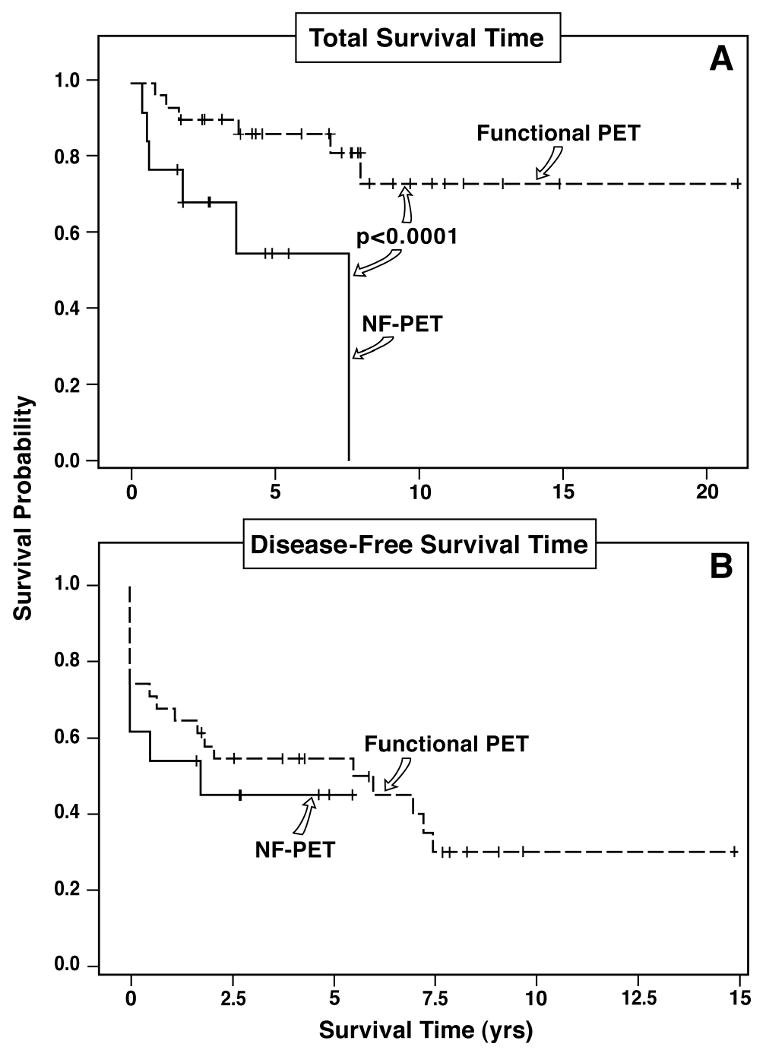
Figure 5.

Kaplan Meier plot of total survival (upper panel) and disease-free survival (lower panel) based on the clinical production of a hormone (gastrin and glucagon); that is, defined as functional vs non-functional pancreatic endocrine tumor (NF-PET). Functional PET had a significantly better total survival than NF-PET (p<0.001, upper panel), but there was no difference in disease-free survival (lower panel).
