Abstract
The enzyme fumarase catalyzes the reversible hydration of fumarate to malate. The reaction catalyzed by fumarase is critical for cellular energetics as a part of the tricarboxylic acid cycle, which produces reducing equivalents to drive oxidative ATP synthesis. A catalytic mechanism for the fumarase reaction that can account for the kinetic behavior of the enzyme observed in both isotope exchange studies and initial velocity studies has not yet been identified. In the present study, we develop an 11-state kinetic model of the enzyme based on the current consensus on its catalytic mechanism and design a series of experiments to estimate the model parameters and identify the major flux routes through the mechanism. The 11-state mechanism accounts for competitive binding of inhibitors and activation by different anions, including phosphate and fumarate. The model is identified from experimental time courses of the hydration of fumarate to malate obtained over a wide range of buffer and substrate concentrations. Further, the 11-state model is found to effectively reduce to a five-state model by lumping certain successive steps together to yield a mathematically less complex representation that is able to match the data. Analysis suggests the primary reaction route of the catalytic mechanism, with fumarate binding to the free unprotonated enzyme and a proton addition prior to malate release in the fumarate hydration reaction. In the reverse direction (malate dehydration), malate binds the protonated form of the enzyme, and a proton is generated before fumarate is released from the active site.
Keywords: Cardiac Metabolism, Computer Modeling, Enzyme Kinetics, Metabolic Regulation, Tricarboxylic Acid (TCA) Cycle
Introduction
The fumarate hydration reaction is the seventh step of the tricarboxylic acid (TCA) cycle, which is the biochemical pathway responsible for oxidizing acetyl-coenzyme A (an end product of carbohydrate and fatty acid oxidation) to generate reducing equivalents to drive the synthesis of ATP in aerobic metabolism. Although fumarase (also called fumarate hydratase) plays a critical role in cellular energy metabolism, a consensus catalytic mechanism that can explain the available kinetic data on the fumarase reaction is yet to be determined. The need for a quantitative understanding of this enzyme's catalytic mechanism is magnified by recent studies that link variability in this enzyme's genetic sequence with altered metabolic function in rat models of hypertension and cardiovascular disease (1).
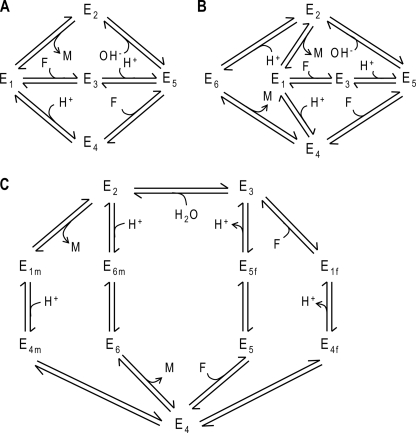
A number of putative mechanisms for mammalian heart-derived and yeast fumarase have emerged from kinetic studies conducted over more than 50 years. Based on isotope exchange studies, Hansen et al. (2) proposed the five-state mechanism with six elementary reaction steps shown in Fig. 1A. In this proposed mechanism, a hydrogen ion and fumarate molecule associate with the enzyme in random order. The next steps in the hydration reaction (conversion of fumarate to malate) involve the addition of a hydroxyl group and dissociation of malate. Rose et al. (3) showed that both protonated and unprotonated forms of the unbound enzyme are able to associate with either malate or fumarate and proposed a six-state mechanism, including a protonated enzyme-malate complex (4), shown in Fig. 1B.
FIGURE 1.
Possible reaction mechanisms for fumarase. A, five-state reversible mechanism proposed by Hansen et al. (2), including the requisite addition and release steps for malate (M), fumarate (F), hydroxyl (OH−), and proton (H+) and two alternative pathways for binding-release of fumarate and one for malate. Subscripts 1, 2, and 3 denote free, malate-bound, and fumarate-bound unprotonated enzyme, respectively; states 4 and 5 correspond to free and fumarate-bound protonated enzyme, respectively. B, six-state reversible mechanism, including an additional protonated enzyme-malate complex E6 (3). Both fumarate and malate can either bind to the protonated or to the unprotonated enzyme. C, 11-state reversible mechanism adapted from Rose et al. (6), including isomechanism-isomerization steps to account for the substrate specificity of the enzyme form and the recycling process. Subscripts f and m denote fumarate and malate specificity, respectively.
Later, Rose et al. (5–7) proposed a mechanism involving a stepwise interconversion of substrate- and product-free enzyme forms associated with proton transfers and conformational changes. This “slow recycling” of the enzyme, as part of the process of recovering from dehydration to be able to initiate a forward reaction, suggests that a malate-specific isoform first undergoes proton transfer and a conformational change to generate a nonspecific state. The different forward and reverse reaction mechanisms described by Rose et al. (5–7) are represented in the consensus mechanism of Fig. 1C, in which all reaction steps are reversible. This mechanism is tested here for its ability to explain the kinetic data.
Data from previous kinetic studies (measurements of quasi-steady initial reaction rates at various reactant concentrations) have been analyzed using mechanisms entirely different from those suggested by the isotope exchange studies. Studies by Alberty et al. (8, 9) and Hill and Teipel (10) have yielded the following conclusions: at low fumarate concentrations (<1 mm), the enzyme exhibits simple Michaelis-Menten kinetics; at intermediate concentrations of fumarate (∼0.001–0.033 m), allosteric activation of the enzyme apparently by binding of substrate to the regulatory site, is observed; and at concentrations of 0.1 m and higher fumarate, apparent inhibition takes place. These observations have been interpreted to reveal negative cooperativity (10, 11). Indeed, the enzyme occurs as a tetrameric complex in mammals with additional sites that can bind both reactants (12). In addition, several anions, including inorganic phosphate, have the capacity to activate the enzyme, presumably through allosteric mechanisms. However, in certain concentrations (less than ∼5 mm) inorganic phosphate acts as an inhibitor. It is not clear if fumarate, malate, phosphate, and other anions compete for binding to the allosteric activation sites. Furthermore, it is not known whether or not the observed inhibition by phosphate at low concentration is due to competition with substrates for the active site. Finally, the kinetics of fumarase have been observed to be sensitive to the ionic strength of the reaction medium (11). Although a number of competing mechanisms have been proposed, no single self-consistent explanation for all of these data has been developed.
Here we report on a series of experiments designed to resolve an explanation for the catalytic and regulatory mechanism of the enzyme and determine the associated kinetic parameters for an isoform purified from pig heart. Rather than obtaining only estimates of quasi-steady initial reaction fluxes, as is typical in studies of enzyme kinetics (10, 11), here we obtained and analyze time courses of reaction progress under a range of reaction conditions. Because these time course data sweep a continuous range of substrate and product concentrations, they contain significantly more information than available from quasi-steady flux measurements alone. Analyzing these data using mechanisms adapted from Rose et al. (5–7), we are able to determine an appropriate mechanistic model that can explain our data.
MATERIALS AND METHODS
Experimental Procedures
Porcine heart fumarase (EC number 4.2.1.2) was obtained from Sigma (F1757) as an ammonium sulfate suspension. 500 units of the enzyme were resuspended in 3.2 m ammonium sulfate and spun down at 10,000 × g for 10 min. The supernatant was carefully removed, and the pellet was resuspended in 0.25 ml of 5 mm sodium phosphate buffer at pH equal to the pK of phosphate (∼6.8) to a final activity of 2000 units/ml. Sodium fumarate solutions of 0.1, 1, 10, and 100 mm concentration were prepared in sodium phosphate buffers at pH 6.8 and total phosphate concentrations of 1, 3.2, 10, 32, and 100 mm. Additional solutions were prepared at pH 6 and 8, at high phosphate concentration (100 mm). The time course of fumarate concentration was measured by reading the absorbance at 220 nm for 0.1 mm, 240 nm for 1 mm, and 300 nm for 10 and 100 mm initial fumarate concentrations, in a 96-well UV transparent microplate in a plate reader (Thermo Electron Varioskan Flash) equipped with precise reagent dispensers. The fumarase reaction was initiated by pipetting 1 μl (2 units) of the enzyme solution on the well bottom and rapidly dispensing 200 μl of fumarate solution using the plate reader's dispenser immediately, which was followed by the recording of the absorbance. Mixing was achieved in the well during the dispensing of 200 μl of fumarate solution, which was verified by measuring the absorbance of a blue dye mixed in a manner similar to the enzyme. The fumarate solution was diluted 10 times for 0.1 mm initial fumarate experiments. Absorbance of fumarate was converted into concentration by means of a calibration curve obtained under the same experimental conditions as the time course measurements. The absorbance measurements during the enzymatic reaction were corrected for the absorbance of the fumarase enzyme in all experiments.
Thermodynamics of the Fumarase Reaction
Fumarase catalyzes the reversible hydration/dehydration of fumarate (FUM) to malate (MAL) through the biochemical reaction (i.e. involving biochemical reactants that are sums of species).
The corresponding reference chemical reaction is as follows.
The standard Gibbs free energy is computed as the sum of the free energies of formation of all species.
Thermodynamic data estimated independently of this study are listed in Table 1.
TABLE 1.
Thermodynamic parameter values for fumarase (values computed for T = 298.15 K and I = 0.1 m) (16)
| Reactant | Abbreviation | Reference species | ΔfG0 | Ion-bound species | pK |
|---|---|---|---|---|---|
| kJ/mol | |||||
| Water | H2O | H2O | −237.19 | ||
| Fumarate | FUM | FUM2− | −600.03 | HFUM− | 4.09 |
| Malate | MAL | MAL2− | −840.59 | HMAL− | 4.715 |
| NaMAL− | 0.28 | ||||
| Inorganic phosphate | Pi | HPO42− | −1096.1 | NaH2PO4− | 6.78 |
| Na2HPO4− | 0.61 |
The equilibrium constant for the reaction is computed from the standard Gibbs free energy.
 |
In our experiments, reactions are assayed in a sodium phosphate buffer. Relationships between species and reactant concentrations, which depend on the pH and concentration of metal ions that reversibly bind to biochemical species, are expressed in terms of the binding polynomials,
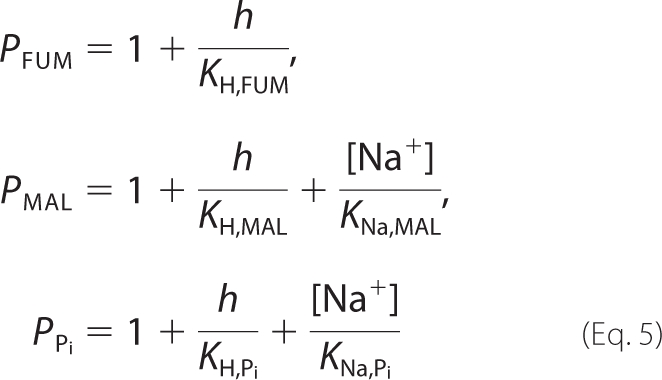 |
where h represents the hydrogen ion activity, h = 10−pH. Specific details on how to derive Equation 5 are provided in the supplemental material. Given these forms of the binding polynomials, relationships between reference species concentrations and reactant concentrations are as follows,
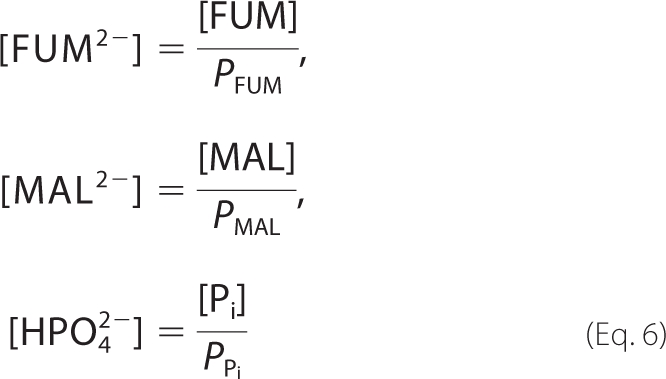 |
where the concentrations [FUM], [MAL], and [Pi] are the total reactant concentrations of fumarate, malate, and inorganic phosphate, respectively. We introduce the chemical activity variables f, m, and p to account for the ionic strength of the solution at a given pH and temperature. These variables correspond to concentrations of fumarate, malate, and phosphate, respectively, weighted by an activity coefficient γ2 for a divalent species.
 |
Over the temperature range T = 273.15–313.15 K, the effect of ionic strength (I) on activity is approximated using the extended Debye-Hückel equation (13, 14),
 |
where z is the charge number of the species, and the parameter B is a constant equal to 1.6 m−½. The quantity α(T) is an empirical function that varies with temperature,
 |
where T is given in Kelvin. The ionic strength of dissolved ions in solution depends on the number n of different types of ions present, their concentration Ci, and their valence zi.
 |
Appropriate values for the pK values at a given ionic strength are approximated (15, 16),
 |
where the sum Σi = 1M is over all species in a given dissociation/association reaction, νi is the stoichiometric coefficient of species i, and the pK(I0) values are given in Table 1 for I0 = 0.1 m.
Multistep Reversible Catalytic Mechanism
Rose et al. (6) describe two different models for the forward and the reverse reaction, positing a slightly different order in reaction processes and strictly unidirectional pathways. Here we combine the two models to obtain the fully reversible 11-state mechanism of Fig. 1C.
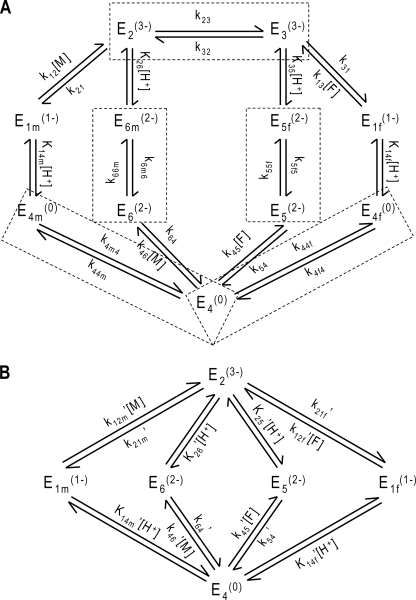
Kinetic rate constants for this 11-state model are defined in Fig. 2A. Unbound enzyme E4 binds H+ and malate or fumarate in arbitrary order to ultimately form complexes E2 and E3. The concept of isomechanism, first introduced in 1993 by Rose et al. (4) in the context of the enzyme fumarase and further studied by Northrop and Rebholz (17, 18) in a number of publications, is the process by which the product is released from an enzyme isoform that differs from the isoform the substrate binds to. The two forms may differ both in the protonation states of acid-base groups and in their conformations. Therefore, the free enzyme must undergo an isomerization step to complete a catalytic cycle. In addition, in both forward and reverse reactions, malate- and fumarate-specific forms of the enzyme/complex, respectively annotated as “m” and “f”, require conformational changes in order for the enzyme to recover to be available for further reactions (5). The substrate-free protonated enzyme (E4) is available to associate with either substrate (fumarate or malate). The pathway E4 → E5 → E2 is thought to be the primary route of forward operation (net production of malate from fumarate) (5), and the pathway E2 → E1f → E4 is thought to be the primary route in the reverse direction (6).
FIGURE 2.
A, 11-state reversible catalytic mechanism adapted from Rose et al. (6), accounting for the isomechanism for enzyme recycling with first-order rate constants. Subscripts f and m denote fumarate and malate specificity, respectively. Dashed line boxes indicate states that are lumped through quasi-equilibrium assumptions. Dead end competitive binding of fumarate and phosphate are not represented. B, six-state model obtained from applying quasi-equilibrium assumptions to the 11-state model in A.
This mechanism may be simplified by assuming rapid equilibrium for H+ binding,
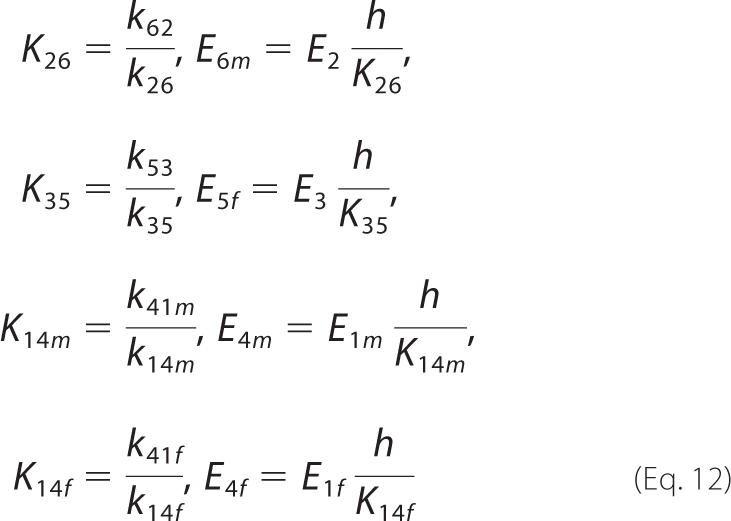 |
where the rate constant kij corresponds to the reaction Ei → Ej.
The formulation of the quasi-steady-state expression for this mechanism is detailed in the supplemental material.
Analysis of the kinetic data (see below) using this model (see supplemental material) revealed that the best fit to the data occurred when the conformation state changes were maintained arbitrarily close to equilibrium. (Details of these simulations are not shown here.) For example, the rate constants k32 and k23 could be set to arbitrarily high values without affecting the ability of the model to fit the data, as long as a constant ratio k32/k23 was maintained. Therefore without diminishing its ability to match the measured kinetics, the model may be reduced in complexity by assuming that these steps are maintained in rapid quasi-equilibrium. Specifically, the following rapid equilibrium assumptions are applied,
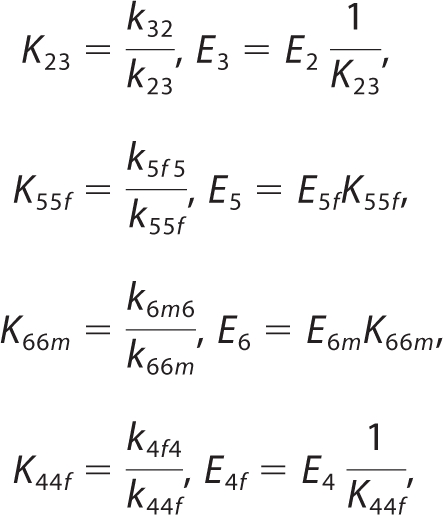 |
 |
In addition, optimal fits to the data are obtained by accounting for the effects of ionic strength by assigning an effective charge to the active site and each enzyme-substrate complex. Several schemes were tested for these charges, chosen to be integers and constrained so that the overall system is balanced in terms of charges. In the scheme shown in Fig. 2A, the unbound protonated active site, E4, is assumed to have valence 0, which was determined to give the best results.
Given these effective charges, the individual rate constants and dissociation constants take the following form,
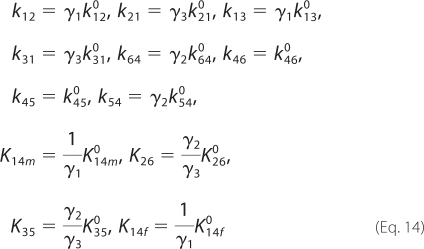 |
where kij0 and Kij0 are the rate and dissociation constants at I = 0, and the activity coefficients are obtained from Equation 8.
Quasi-steady-state Model
In our experiments, the total amount of enzyme is by several orders of magnitude lower than the initial fumarate concentrations used. In this case, the kinetics of the reaction can be described by a steady-state approximation of the enzyme states.
At steady state, the net production of malate is equal to the net consumption of fumarate.
 |
Combining Equations 12–15, E2 can be expressed as a function of E4,
where
 |
The total enzyme concentration is conserved.
 |
Here the factors Ii represent inhibition terms that account for dead-end binding of inhibitors to any of the 11 states in the full scheme of Fig. 2A. Each factor depends on the concentration ck of the inhibitor k and its associated dissociation constant Ki,k according to the general form,
 |
where the term Ii is associated with competitive binding at enzyme state i. To analyze our kinetic data we assumed a general inhibition pattern, with fumarate and phosphate potentially participating in dead-end binding to each enzyme state.
 |
This inhibition pattern assumes that fumarate and phosphate form dead-end complexes with enzyme state Ei. This general model includes 22 inhibition constants. In analyzing the kinetic data below, the majority of these inhibition steps were judged unnecessary to explain the data and have been removed from the model.
Combining Equations 12–18, we can obtain the following.
 |
In addition to the apparent inhibitory effects, our model assumes that binding of anions to an allosteric regulatory site is necessary for catalysis. To model this effect, we compute the fraction of enzyme that is catalytically active as the fraction that is bound to any of a number of specific anions,
 |
where cj represents the set of anions thought to act as allosteric activators, and Ka,j is the associated dissociation constant. Specifically, the model allows for possible activation by phosphate and fumarate.
 |
(Allowing for activation by malate does not improve the fits to the data.) Given the above, the net steady-state flux is computed as follows,
where E6 and E1m are computed from Equations 12, 13, 16, 17, and 21.
Thermodynamic Constraints on Model Parameters
Feasible values for the rate constants are constrained by several thermodynamic relationships. First, the chemical equilibrium constant for the reaction can be shown to be equal to the following ratio.
 |
Second, there exist two additional thermodynamic constraints associated with non-productive loops in the catalytic cycle.
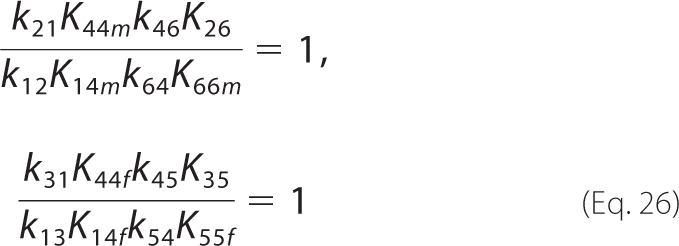 |
Alternate Formulation
The 11-state model may be further simplified by lumping sequential step conformation states into single kinetic states. Assuming quasi-equilibrium for these conformations (Equation 13), the mechanism of Fig. 2A is equivalent to the model of Fig. 2B, in which the correspondence between rate/dissociation constants is as follows,
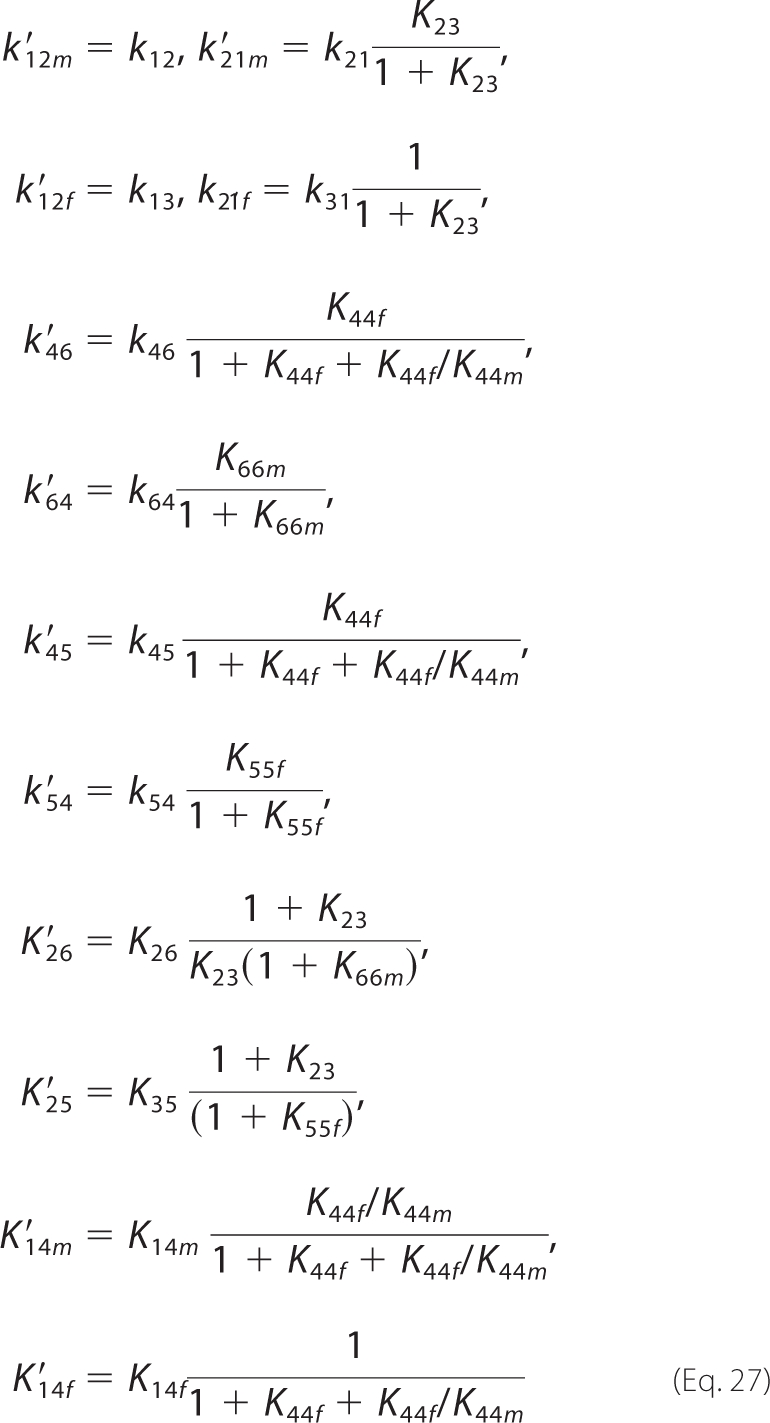 |
and the new expressions for inhibition constants are as follows.
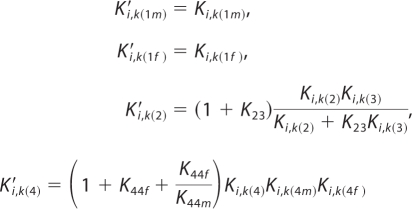 |
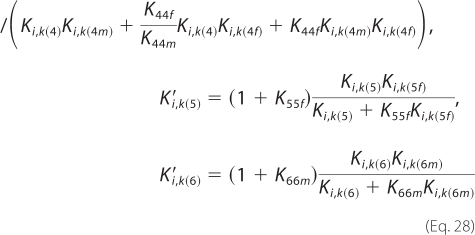 |
With this formulation, the number of adjustable parameters can be reduced by five.
Equations 17 and 21 then reduce to the following,
 |
and
 |
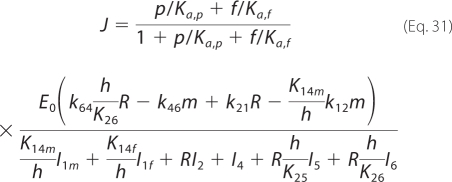
The expressions for R and E4, from Equations 29 and 30, may be substituted in the flux expression (Equation 24) defined from the mass balance, to yield the quasi-steady-state law.
 |
Time Course Simulations
In a well mixed reaction system, the kinetics of fumarate and malate are governed by the ordinary differential equations,
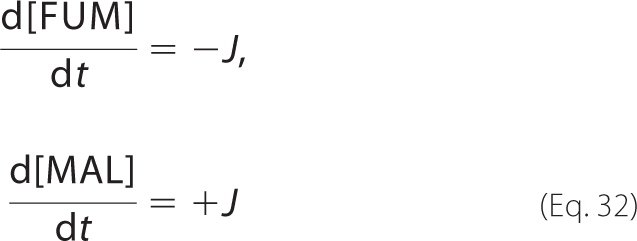 |
where J is the quasi-steady-state flux given by Equation 24 or 31.
Local Sensitivity Analysis
A local sensitivity analysis is applied to estimate the sensitivity of the model prediction to small changes in parameters values. A sensitivity coefficient is computed for each parameter,
 |
where E is the minimum mean squared difference between model estimations and data, and xi is the value of the ith parameter.
RESULTS
The model proposed in this paper is identified based on time course data obtained over a large range of pH (pH 6–8) and substrate (0.1–100 mm) and phosphate (1–100 mm) concentrations. The model is then used to investigate previously reported phenomena of effective substrate inhibition, negative cooperativity, and inhibition by phosphate.
Model Identification
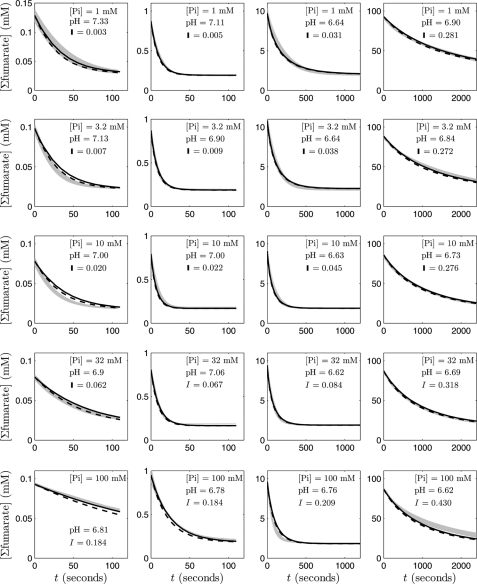
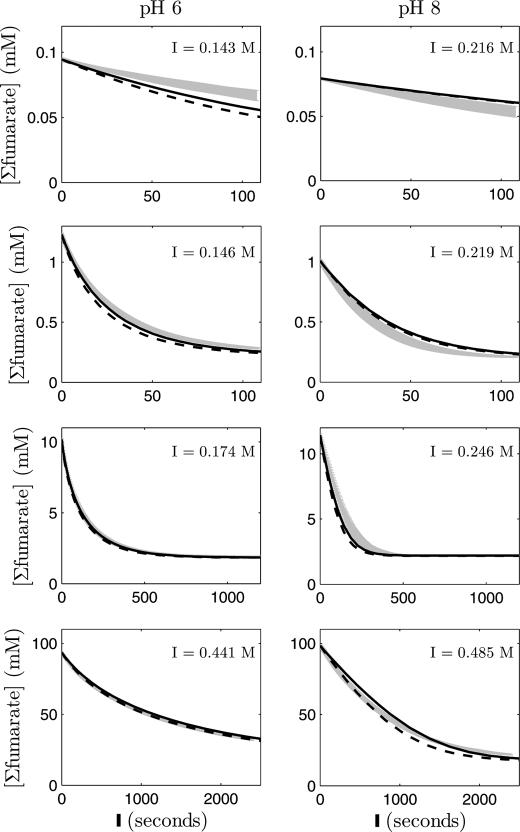
Fig. 3 shows measurements of fumarate decay time courses given initial fumarate concentrations spanning 2 orders of magnitude (from ∼0.1 to 100 mm initial fumarate) and obtained at five different phosphate concentrations. In each case, initial malate is zero. The 20 different progress curves provide data on reaction rate over a wide range of substrate, product, and phosphate concentration. The data in Fig. 4 represent time course measurements at zero initial malate at 100 mm total phosphate over a range of initial fumarate concentrations and pH.
FIGURE 3.
Fumarate concentration versus time for the fumarase-catalyzed hydration of fumarate to malate, at 25 °C, pH ∼6.78, in five different phosphate buffer concentrations (1, 3.2, 10, 32, and 100 mm Pi from top to bottom). For each of the five phosphate concentrations, four different initial fumarate concentrations were tested (∼0.1–100 mm from left to right). The gray shaded bars indicate means ± S.E. of the experimental data; the solid black lines are optimum model fits; and the dashed lines correspond to model fits obtained from using average parameter values (n = 3–6).
FIGURE 4.
Fumarate concentration versus time for the fumarase-catalyzed hydration of fumarate to malate, at 25 °C, 100 mm phosphate, and two different pH values (pH 6 and 8). For each of the pH values, four different initial fumarate concentrations were tested (∼0.1–100 mm from top to bottom). The gray shaded bars indicate means ± S.E. of the experimental data; the solid black lines are model fits; and dashed lines correspond to model fits obtained from using average parameter values (n = 3–6).
In sum, the data in Figs. 3 and 4 provide the means to identify the adjustable parameters associated with either the full mechanism of Fig. 2A or the reduced mechanism of Fig. 2B. Analysis based on the full model showed that it could be reduced based on the rapid equilibrium of the conformational changes, as described under “Materials and Methods,” without affecting the fitting results.
The solid lines in Figs. 3 and 4 correspond to optimum model fits simulated using the reduced model based on Equation 32 with buffer conditions for each case reported in the legend and on the graphs. Dashed lines correspond to model fits obtained from using average parameter values from 60 independently obtained Monte Carlo samples of the optimal parameter space. Because the underlying model is nonlinear, the behavior associated with the mean values of 60 optimal parameter estimates is not necessarily optimal. Thus, the dashed line fits are slightly worse than the optimal solid line model fits. The parameter values associated with the model fits in Figs. 3 and 4 are listed in Table 2, along with the sensitivity coefficients estimated from Equation 33. Based on the 60 independent realizations of optimal parameter sets, we found that the estimated values of a given parameter were distributed symmetrically around its mean value in the logarithmic space (i.e. the parameter distributions could be explained by the log-normal distribution). Thus, the statistics in Table 2 are reported for the log10 of the individual parameters. The S.D. σlp is the estimated S.D. from the 60 samples of the log10 of the parameter value.
TABLE 2.
Estimated model parameters
Sensitivity coefficients are computed according to Equation 33. Rate constants k64, k21m and k12f are deducted from other rate and dissociation constants (cf. Equations 25 and 26 for thermodynamic constraints).
| Adjustable parameter | Optimum estimated value p | lp ± σlp (lp = log10p) | Mean of the optima (10lp) | Sensitivity coefficient | Unit |
|---|---|---|---|---|---|
| Keq | 3.5006 | 0.5473 ± 0.0069 | 3.5266 | 9.0674 | |
| k12m0 | 0 | 0 | 0 | Not identified | m−1 s−1 |
| k460 | 1.91 × 10⁶ | 6.3714 ± 0.1535 | 2.53 × 10⁶ | 2.1041 | m−1 s−1 |
| k450 | 4.46 × 10⁵ | 5.7131 ± 0.1382 | 5.45 × 10⁵ | 1.2590 | m−1 s−1 |
| k540 | 54.12 | 1.7547 ± 0.0776 | 57.80 | 2.7144 | s−1 |
| k21f0 | 5.82 × 10⁴ | 4.6638 ± 0.5725 | 9.99 × 10⁴ | 0.2963 | s−1 |
| K260 | 8.28 × 10⁻⁸ | −7.0108 ± 1.1345 | 1.07 × 10⁻⁶ | 0.0163 | m |
| K250 | 1.81 × 10⁻¹⁰ | −9.6854 ± 0.5363 | 3.91 × 10⁻¹⁰ | 0.2705 | m |
| K14m0 | 0 | 0 | 0 | Not identified | m |
| K14f0 | 7.69 × 10⁻⁹ | −8.4373 ± 0.7186 | 1.19 × 10⁻⁸ | 0.1426 | m |
| Ka,f | 31.5 × 10⁻³ | −1.4961 ± 0.0497 | 32.1 × 10⁻³ | 0.1446 | m |
| Ka,p | 0.58 × 10⁻³ | −3.2342 ± 0.0552 | 0.59 × 10⁻³ | 0.2773 | m |
| Ki,p(lf)0 | 14.3 × 10⁻³ | −2.2401 ± 0.6673 | 15.1 × 10⁻³ | 0.0837 | m |
| Ki,p(4)0 | 41.7 × 10⁻³ | −1.2348 ± 0.6109 | 165.0 × 10⁻³ | 0.0320 | m |
| Ki,f(lf)0 | 4.0 × 10⁻³ | −2.3149 ± 0.7273 | 20.3 × 10⁻³ | 0.0452 | m |
| Ki,f(4)0 | 90.7 × 10⁻³ | −1.1176 ± 0.8287 | 272.1 × 10⁻³ | 0.0146 | m |
Here Keq is treated as an adjustable parameter, yielding an estimate of 3.5. The value computed from Equation 4 and the reported thermodynamic data in Table 1 is 3.86. The model fits and data are in good agreement with model predictions within the S.E. in the data or within 10% of the observed mean. However, some systematic discrepancy is observed on some of the data sets (e.g. Fig. 3; 1 mm fumarate, 3.2–10 mm Pi). Even in its more complex form, the model was unable to perfectly fit those data. Systematic bias in the model could be due to inadequacies in the Debye-Hückel model over the observed range of buffer conditions or incompleteness of the model. Better fits could be obtained, for example, by adding hydrogen ion binding inhibition steps, at the expense of additional complexity and adjustable parameters. Otherwise, the majority of parameters are estimated with reasonable sensitivities of 10% or more. Parameters k12m0 and K14m0 are assigned values of zero because optimization against the kinetic data yielded values that were effectively zero.
The activating and inhibiting effects of several inorganic anions on both the forward and reverse reactions have been reported by Massey (19, 20) and studied later by Alberty et al. (9). As an initial guess, fumarate and phosphate were assumed to inhibit each of the enzyme states with a different inhibition constant. Although this general scheme greatly increases the number of adjustable parameters, it allows us to consider every possible inhibition pattern. The resulting optimal fits reveal that many of these inhibition steps and associated parameters can be omitted. Dead end binding inhibition reactions necessary to explain the data are found to be phosphate and fumarate binding to enzyme states 4 and 1f. Estimated binding constants for these reactions are listed in Table 2.
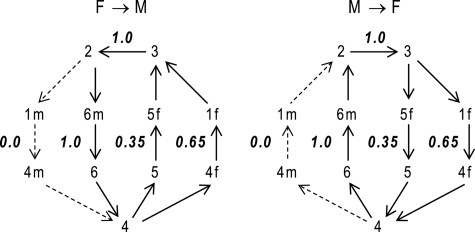
Model-predicted relative fluxes through the catalytic mechanism under steady-state conditions at pH 7, I = 5 mm, [Pi] = 1 mm, and fumarate and/or malate concentrations of 1 mm, are reported in Fig. 5. Given the parameter set that best fits our kinetic data (with k12m0 = 0), the developed model predicts that the primary reaction routes for both hydration of fumarate to malate and dehydration of malate to fumarate involve the binding/release of fumarate to a free unprotonated enzyme, E1f. Furthermore, the model predicts that there is essentially no flux through the states 1m and 4m. This is because the best fits to the data occur when the parameter k12m0 approaches values arbitrarily close to zero. This observation implies that the model may be further reduced to a five-state model by omitting this pathway. In that case, the malate-specific unprotonated isoform would only bind to the free protonated form E4. Equations 29–31 then become the following.
 |
 |
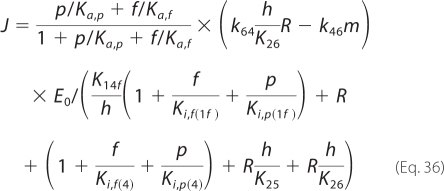 |
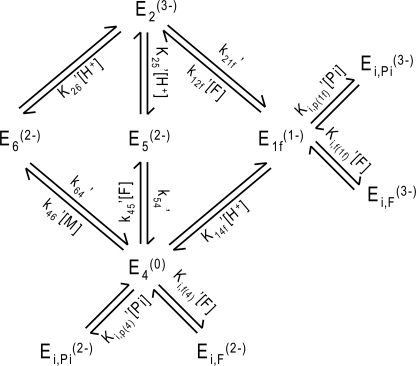
The resulting five-state model (with additional inhibited states) is illustrated in Fig. 6 and discussed below.
FIGURE 5.
Primary routes for both forward (F → M) and reverse (M → F) reactions, along with associated relative net fluxes for each individual pathway. Approximate physiological conditions are used (pH 7, 1 mm fumarate (f) or malate (m) and 1 mm Pi).
FIGURE 6.
Reduced five-state mechanism adapted from the model of Fig. 2B. The pathway implicating the free unbound enzyme state E1m is neglected. The identified inhibition pattern is also illustrated.
DISCUSSION
To develop an accurate yet appropriately simple model to describe the kinetics of fumarase, the mechanism of Rose (5, 6) and Rose and Weaver (7) was used to build a kinetic model and analyze a large scale kinetic data set. Analysis of the full model of Fig. 2A revealed that a number of simplifying assumptions are justified in comparing model predictions with the kinetic data. Specifically, the reduced six-state model of Fig. 2B (which was further simplified to the five-state model of Fig. 6) is shown to capture the observed kinetics. It has been proposed that isomechanisms could be identified from fumarase kinetics by product inhibition (21, 22). However, those analyses were shown to be incorrect (23). Indeed, despite a comprehensive set of kinetic data and a detailed model of the mechanism, we were unable to demonstrate the influence of the isomerization steps on the kinetics. The isomerization steps are assumed to be in rapid equilibrium in our simplified five-state model.
Although results from this reduced model are emphasized, several different reduced five-state models were tested for their ability to represent the data. One alternative model was based on the assumption that the primary pathway for fumarate release is predominant and the secondary one may be neglected. Another assumed only one possible pathway for malate binding and/or release and two alternative pathways for fumarate binding/release. Another alternative mechanism assumed that both substrates (fumarate and malate) only bind to the protonated form of the enzyme. Therefore, the unprotonated state E1 may be omitted in the kinetic analysis. Analysis revealed that the five-state mechanism of Fig. 6 is the simplest version of the model able to match the experimental data analyzed below. Similarly, alternative inhibition schemes with dead end binding of fumarate at sites other than those indicated in Table 2 and Fig. 6 are unable to match the data and/or are not able to improve the model fits to the data compared with the formulations used here.
Activation of the Enzyme
Based on measurements of the forward reaction initial fluxes as functions of phosphate concentration, in the limit of low fumarate concentrations, Alberty et al. (9) determined that phosphate activates the enzyme with an apparent half-activation concentration at [Pi] ∼20–30 mm. This value is significantly different from our estimated activation constant Ka,p = 0.58 mm, which is measured relative to the activity of the species HPO42−. At pH 7 and in the limit of low fumarate concentrations, our data show an activation by phosphate with an apparent half-activation of [Pi] ∼0.7 mm. However, at phosphate concentrations higher than ∼7 mm, phosphate clearly inhibits the reaction. Note that it is difficult to directly compare our data and model with that of Alberty et al. (9) because the detailed conditions of the buffer used in the experiments of Alberty et al. are not known.
Inhibition
It has been proposed that inorganic phosphate acts as an inhibitor of fumarase at low concentrations of fumarate (in the range of a few mm and less), perhaps through competitive binding to the active site (9). This observation was repeated in studies by Hasinoff and Davey (11), who investigated the fumarase kinetics at a constant ionic strength. Our model captures this effect of inhibition by inorganic phosphate at low fumarate concentrations. Furthermore, model fits require that the inhibition constants take into account the effect of the ionic strength, by assigning effective charges on each enzyme state (see Fig. 2). This phenomenon implies that variation in ionic strength is partly responsible for some of the apparent inhibition observed in previous studies.
In addition, inhibition by substrate has been reported by Alberty et al. (9) at very high fumarate (>100 mm). Although the developed model includes inhibition by fumarate via dead end binding steps, these inhibition steps do not result in an obvious or significant reduction in flux as fumarate concentration is increased over the range of 0–100 mm and under the conditions employed here.
Cooperativity
Our results are not consistent with previous reports of negative cooperativity (10, 11). In particular, Hasinoff and Davey (11) report that an apparent negative cooperativity was obtained at a constant ionic strength. However, it is not possible to directly compare our results with those of Hasinoff and Davey (11). In their experiments, Hasinoff and Davey added NaCl and NaNO3 to the buffer solution to maintain a constant ionic strength, in concentrations that are not reported. Previous studies have shown that Cl− acts as an activator of fumarase. An accurate comparison between our model predictions and these data would require accounting for such an activating effect of Cl− as well as potential effects of NO3− as an inhibitor and/or activator. It is therefore not possible to unambiguously analyze those data with the model developed here. Nonetheless, it is worth noting that the steady-state flux equation in our model has the general form of Equation 1 in Ref. 11.
In the present study, in contrast to previous studies, the complete make-up of the buffer is reported for all experiments, along with estimated ionic strength based on the dissociation constants reported in Table 1. The model matches the kinetic data over ranges of fumarate and malate concentration spanning 4 orders of magnitude (from 0.1 to 100 mm) and phosphate spanning 3 orders of magnitude (from 1 to 100 mm).
pH Effect
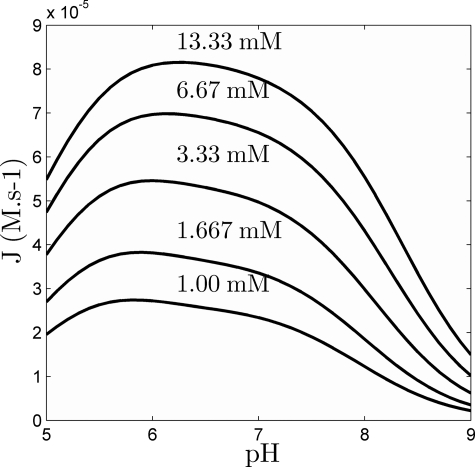
Alberty et al. (9) reported experimental measurements of the pH dependence of the initial velocities at high phosphate concentration (133 mm) and for increasing fumarate concentrations. Fig. 7 plots model predictions of the net quasi-steady-state flux versus pH, under the same conditions. (Compare with Alberty et al. (9) (Fig. 1).) Here, model predictions are based on the assumption that ionic strength varies according to the pH and according to the composition of the buffer. (The buffer conditions used in Ref. 9 are not reported.) Regardless, the model predictions reproduce the previously reported asymmetric bell-shaped curves, yet the predicted peaks are slightly shifted toward lower pH than in Ref. 9.
FIGURE 7.
Predictions of the quasi-steady-state net flux of the forward reaction as a function of pH, at 25 °C, 133 mm Pi, for several values of fumarate concentration (1–13.33 mm, as indicated).
Forward Versus Reverse Operation of the Catalytic Mechanism
Rose et al. (5) report that the pathway E4 → E5 → E2 is the primary route of the forward operation and that the pathway E2 → E1f → E4 is the primary route in the reverse direction (6). As illustrated in Fig. 5, under physiological conditions, our model predicts that both pathways are active in the forward and the reverse directions, with about one-third of the flux going through the first pathway and two-thirds through the second. The relative flux values in Fig. 5 do not depend substantially on the values of parameters not sensitively estimated, with less than 10% variability predicted for the ensemble of 60 independently obtained optimal parameter sets.
CONCLUSIONS
In summary, an 11-state model for the reversible catalytic mechanism of fumarase was formulated in terms of chemical species and accounting for ionic strength and pH as well as dead end binding with inhibitors and binding of anionic activators. The model was identified by fitting experimental time courses of the fumarate disappearance during fumarate hydration over a wide range of substrate and phosphate concentrations and pH. Although the model developed here is consistent with both the catalytic mechanism proposed by Rose et al. (6) and data reported here, both the present model and data are inconsistent with some of the phenomena reported in the literature, such as substrate inhibition at high fumarate concentrations and negative cooperativity.
Based on identified rapid equilibrium steps, this 11-state model is reduced to a six-state model. It is further suggested that the pathway involving the malate-specific free unprotonated enzyme state is not used in either the forward or the reverse reaction under the conditions assayed here, resulting in an effective 5-state model.
Supplementary Material
Footnotes
This work was supported, in whole or in part, by National Institutes of Health Grant HL094317.

The on-line version of this article (available at http://www.jbc.org) contains supplemental Fig. 1 and Equations 1–10.
REFERENCES
- 1. Tian Z., Liu Y., Usa K., Mladinov D., Fang Y., Ding X., Greene A. S., Cowley A. W., Jr., Liang M. (2009) Hypertension 54, 255–260 [DOI] [PMC free article] [PubMed] [Google Scholar]
- 2. Hansen J. N., Dinovo E. C., Boyer P. D. (1969) J. Biol. Chem. 244, 6270–6279 [PubMed] [Google Scholar]
- 3. Rose I. A., Warms J. V., Kuo D. J. (1992) Biochemistry 31, 9993–9999 [DOI] [PubMed] [Google Scholar]
- 4. Rose I. A., Warms J. V., Yuan R. G. (1993) Biochemistry 32, 8504–8511 [DOI] [PubMed] [Google Scholar]
- 5. Rose I. A. (1997) Biochemistry 36, 12346–12354 [DOI] [PubMed] [Google Scholar]
- 6. Rose I. A. (1998) Biochemistry 37, 17651–17658 [DOI] [PubMed] [Google Scholar]
- 7. Rose I. A., Weaver T. M. (2004) Proc. Natl. Acad. Sci. U.S.A. 101, 3393–3397 [DOI] [PMC free article] [PubMed] [Google Scholar]
- 8. Alberty R. A. (1959) The Enzymes, 2nd Ed., p. 154, Academic Press, Inc., New York [Google Scholar]
- 9. Alberty R. A., Massey V., Frieden C., Fuhlbrigge A. R. (1954) J. Am. Chem. Soc. 76, 2485–2493 [Google Scholar]
- 10. Hill R. L., Teipel J. W. (1971) The Enzymes, 3rd Ed., pp. 552–553, Academic Press, Inc., New York [Google Scholar]
- 11. Hasinoff B. B., Davey J. P. (1986) Biochem. J. 235, 891–893 [DOI] [PMC free article] [PubMed] [Google Scholar]
- 12. Beeckmans S., Van Driessche E. (1998) J. Biol. Chem. 273, 31661–31669 [DOI] [PubMed] [Google Scholar]
- 13. Alberty R. A. (2003) Thermodynamics of Biochemical Reactions, p. 47, Wiley-Interscience, Hoboken, NJ [Google Scholar]
- 14. Beard D. A., Qian H. (2008) in Chemical Biophysics: Quantitative Analysis of Cellular Systems, p. 36, Cambridge University Press, Cambridge, UK [Google Scholar]
- 15. Vinnakota K. C., Wu F., Kushmerick M. J., Beard D. A. (2009) Methods Enzymol. 454, 29–68 [DOI] [PMC free article] [PubMed] [Google Scholar]
- 16. Li X., Dash R. K., Pradhan R. K., Qi F., Thompson M., Vinnakota K. C., Wu F., Yang F., Beard D. A. (2010) J. Phys. Chem. B 114, 16068–16082 [DOI] [PMC free article] [PubMed] [Google Scholar]
- 17. Northrop D. B., Rebholz K. L. (1994) Anal. Biochem. 216, 285–290 [DOI] [PubMed] [Google Scholar]
- 18. Northrop D. B., Rebholz K. L. (1997) Arch. Biochem. Biophys. 342, 317–321 [DOI] [PubMed] [Google Scholar]
- 19. Massey V. (1953) Biochem. J. 53, 67–71 [DOI] [PMC free article] [PubMed] [Google Scholar]
- 20. Massey V. (1953) Biochem. J. 55, 172–177 [DOI] [PMC free article] [PubMed] [Google Scholar]
- 21. Rebholz K. L., Northrop D. B. (1993) Biochem. J. 296, 355–360 [DOI] [PMC free article] [PubMed] [Google Scholar]
- 22. Rebholz K. L., Northrop D. B. (1994) Arch. Biochem. Biophys. 312, 227–233 [DOI] [PubMed] [Google Scholar]
- 23. Cornish-Bowden A. (1994) Biochem. J. 301, 621–623 [DOI] [PMC free article] [PubMed] [Google Scholar]
Associated Data
This section collects any data citations, data availability statements, or supplementary materials included in this article.


