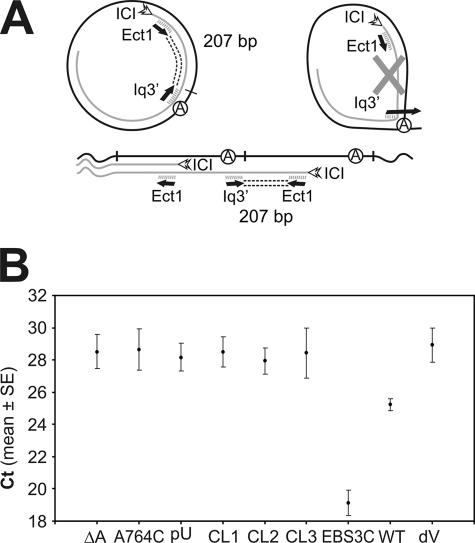
FIGURE 4.
Quantitative real-time RT-PCR data analysis of RmInt1 products in which the 5′ and 3′ extremities are linked. A, schematic diagram of the expected PCR products. cDNA was synthesized from S. meliloti RMO17 total RNA carrying various plasmid constructs, with the ICI oligonucleotide primer. qPCR was performed in the iCycler iQ system (Bio-Rad), with the Ect1 and Iq3′ primers and SYBR Green I. Amplification generates a 207-bp product from intron RNA templates with linked extremities, whether in the form of circular introns or tandem, head-to-tail intron copies, but not from a lariat template. B, amplification levels of the 207-bp product for WT, coordination loop, EBS3, branch site, and domain V mutants. The graph shows the threshold cycle (Ct) for the indicated constructs. The Ct is the point at which the fluorescence intensity of the reaction first exceeds the background level. The data shown are means ± S.E. of at least two replicates in 96-well plates and three independent reactions, each with a different RNA preparation. Three main groups can be distinguished: the WT group, Ct ≈ 25 (∼2.7 × 10⁴ cDNA copies/50 ng total RNA); the putative branch site-docking group, Ct ≈ 28.36 (∼103 cDNA copies/50 ng total RNA), which includes splicing-defective domain I and domain VI mutants, with levels close to the background level displayed by the domain V mutant (Ct ≈ 29); and the EBS3 group, Ct ≈ 19 (∼2.6 × 10⁶ cDNA copies/50 ng total RNA). (qPCR parameters: E > 92% and R2 > 0.991). DNA standard curves were generated for quantification, and melting curve analysis was carried out in all PCR runs, to check that there were no primer dimers (not shown). RNA samples not treated with reverse transcriptase and negative controls containing no template were included to monitor the reactions (not shown).

