FIGURE 1.
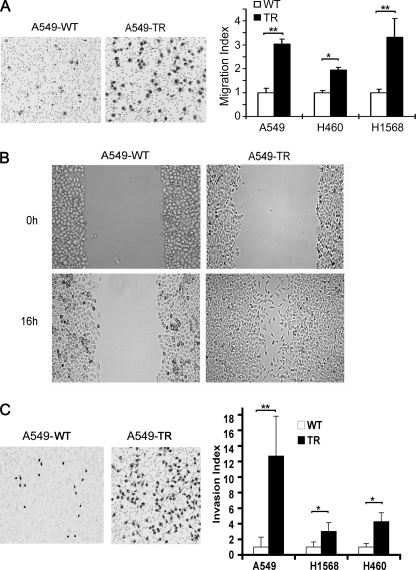
Increased migration and invasion capacities in the cells with acquired TRAIL resistance. A, migration assay. WT and TR of A549, H460, and H1568 cells (2 × 10⁴ in 100 μl of serum-free medium) were seeded in the top chamber of transwell chambers for migration for 6 h (see “Materials and Methods”). Representative images of migrated A549-WT and -TR cells are shown (left). Quantification of cell migration of each cell line is shown (right). Data shown are mean ± S.D. *, p < 0.05; **, p < 0.01. B, wound healing assay. Cell cultures in confluence were scratched and photographed immediately after scratching the wound (0 h) or 16 h post scratching. Representative images are shown. C, invasion assay. A549-, H460-, and H1568-WT or TR cells (5 × 10⁴ in 200 μl serum-free medium) were seeded in the top chamber that contained a layer of Matrigel, whereas the lower chamber contained medium with 10% FBS as chemoattractant. After incubation for 24 h, invaded cells on the lower membrane surface were detected. Representative images of migrated A549-WT and -TR cells are shown (left). Quantification of cell migration of each line is shown (right). Data shown are mean ± S.D. *, p < 0.05; **, p < 0.01.

