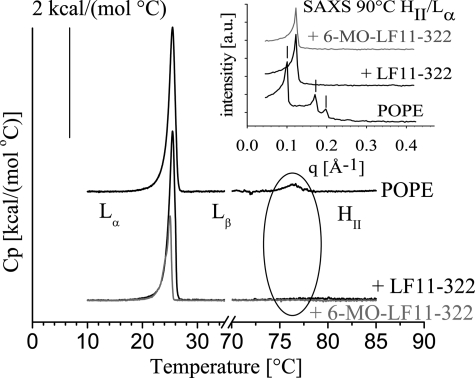
FIGURE 3.
DSC thermograms of POPE in the absence and in the presence of peptides (25:1, lipid-to-peptide molar ratio). For clarity, the DSC curves were displaced on the ordinate by arbitrary units. Scan rate was 30 °C/h. N-Acylated peptides are shown in gray. Phase transition from Lα to HII is highlighted. Inset, SAXS diffraction pattern in the absence and presence of peptide at 90 °C. POPE displays the typical pattern of HII phase (lines indicating the Bragg peaks at q values of 0.099, 0.171, and 0.197 Å−1). In the presence of peptides the lipid is in the fluid phase.

