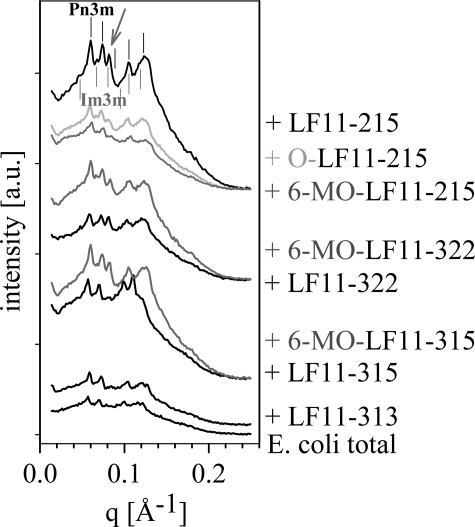
FIGURE 4.
SAXS patterns of an aqueous dispersion of E. coli membrane total lipid extract at 25 °C after one heating/cooling cycle (25/85/25 °C). Position of the hkl reflections corresponding to a cubic phase of space group Pn3m are indicated by perpendicular black lines and of space group Im3m by gray lines. Arrow indicates the third order peak of Im3m. For corresponding lattice spacing see Table 3.

