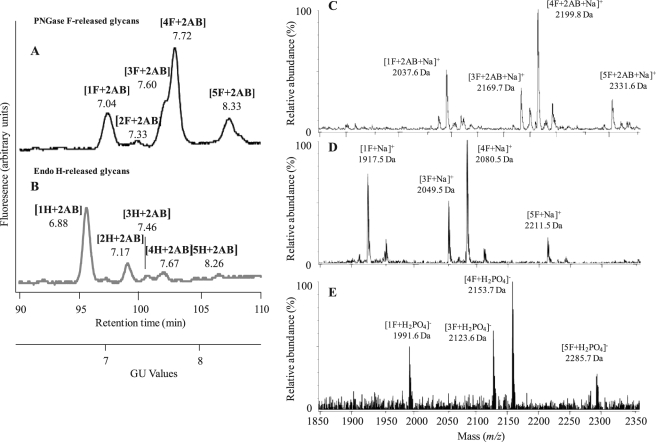
FIGURE 1.
A and B, NP-HPLC profiles of 2AB-labeled N-glycans released from the sugar moieties of the 66-kDa glycoprotein after PNGase F (A) and Endo H digestion (B) are shown. Retention times were converted to a GU scale relative to a dextran ladder. GU values are shown beneath the designation of each. C–E, mass determination of PNGase F-released glycans from the 66-kDa glycoprotein is shown. Positive ion MALDI-TOF MS of the total 2AB-labeled N-glycans (C) and unlabeled N-glycans (D) released from the 66-kDa glycoprotein by PNGase F is shown. E, negative ion ESI mass spectra of the total N-glycans released from the 66-kDa glycoprotein by PNGase F are shown. Interpretation of peak masses in terms of sugar composition and the calculated masses of the ions are summarized in Table 1.

