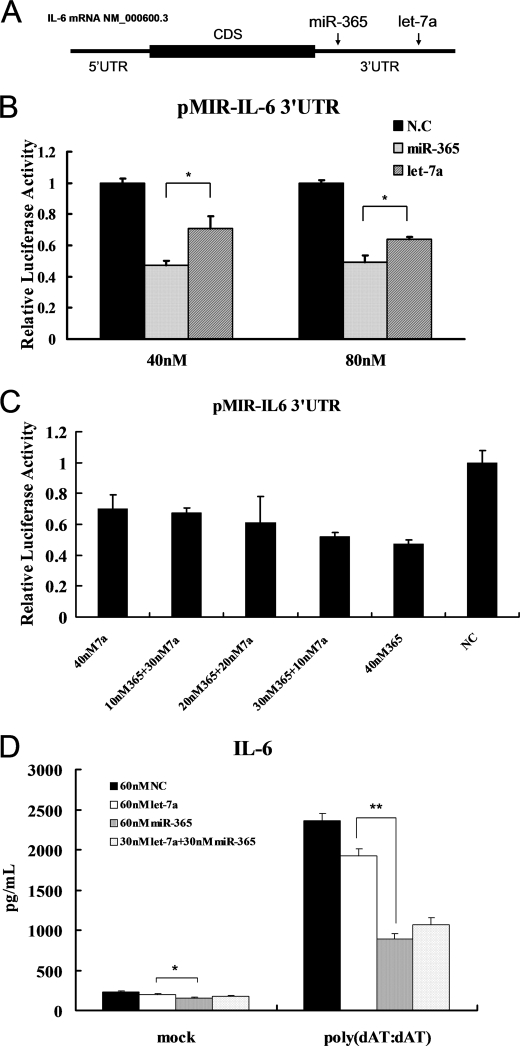
FIGURE 6.
Comparison of the effect of miR-365 and let-7a on IL6 expression in vitro. A, shown is a schematic representation of the MREs for let-7a and miR-365. The MREs for let-7a and miR-365 were obtained from the report by Iliopoulos et al. (36) and our study, respectively. CDS, coding sequence. B, pMIR-IL-6 3′-UTR was co-transfected with miR-365 or let-7a into HEK293 cells. Luciferase activities were measured at 24 h post-transfection. NC, negative control. *, p < 0.05. C, pMIR-IL-6 3′-UTR was co-transfected with a total of 40 nm miRNA composed of individual or mixed miR-365 and/or let-7a at the indicated ratios. Luciferase activities were measured 24 h post-co-transfection. D, HeLa cells were transfected with a total of 60 nm miR-365 and/or let-7a mimics or scrambled oligonucleotides as indicated. Cells were transfected with poly(dAT:dAT) at 24 h after the initial transfection. Culture supernatants were collected 24 h later, and IL-6 was measured using a human IL-6 ELISA kit. Bar graph data are presented as the means ± S.D. (n = 3). *, p < 0.05; **, p < 0.01.

