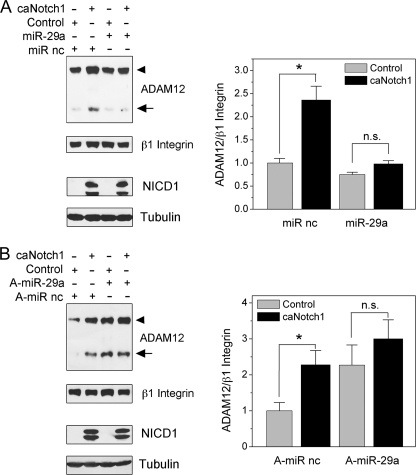
FIGURE 7.
The role of miR-29a in the up-regulation of ADAM12 expression by Notch. A, NIH3T3 cells were transfected with miR-29a mimic or miR mimic negative control (miR nc). After 24 h, cells were infected with caNotch1 or control viruses and analyzed 48 h later. ADAM12 protein levels were examined by Western blotting after glycoprotein enrichment, and β1 Integrin indicates a gel loading control. The nascent form of ADAM12 is indicated by an arrowhead, and the mature form of ADAM12 is shown by an arrow. NICD1 levels were measured in total cell lysates, and Tubulin indicates a gel loading control. B, NIH3T3 cells were transfected with miR-29a hairpin inhibitor anti-miR-29a (A-miR-29a) or miR inhibitor negative control (A-miR nc). After 24 h, cells were infected with caNotch1 or control viruses and analyzed 48 h later, as in panel A. The bar graphs on the right show quantification of the signal intensities of ADAM12, normalized to β1 integrin; the data represent the means ± S.E. from 2 independent measurements, *, p < 0.05, n.s., not significant.

