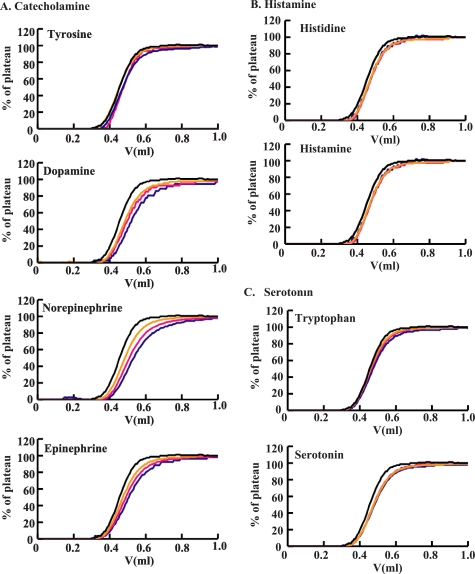
FIGURE 5.
Interaction between polySia and selected neurotransmitters as measured by frontal affinity chromatography. A, elution profiles of various catecholamines after passing through columns with immobilized polySia. B, histamines. C, serotonins. The neurotransmitters were dissolved in PBS at concentrations of 10 μm (blue), 20 μm (pink), and 30 μm (yellow). Two ml of each solution was applied to the column (126 μl) through a 2-ml loop at a flow rate of 0.125 ml/min at 25 °C. Each elution pattern is superimposed on that of acetylcholine (black). The Kd values obtained by three independent experiments are summarized in Table 2.

