FIGURE 7.
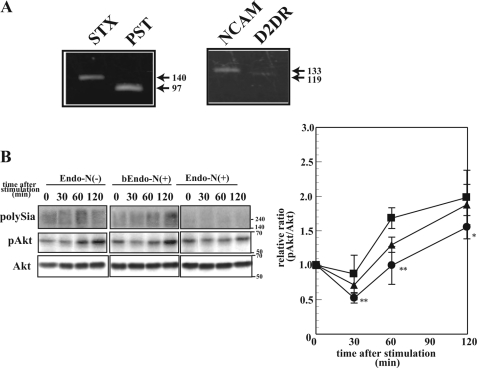
Effects of polySia expression on DA-induced Akt signaling. A, RT-PCR of STX, PST, NCAM, and D2DR. The cDNA derived from SK-N-SH cells was used as template for PCR that was performed with specific primers as described in supplemental Table S1. The PCR products were analyzed with 1% agarose gels and visualized with ethidium bromide. B, phosphorylation of Akt after the DA stimulation. SK-N-SH cells were treated with or without Endo-N (Endo-N(+) or Endo-N(−), respectively) or with boiled EndoN (bEndo-N(+)). The polysialylation state was analyzed by the immunostaining of polySia (top, polySia). The cells were then treated with DA for 0, 30, 60, and 120 min, and the homogenates were analyzed by Western blotting with anti-phosphorylated Akt antibody and anti-Akt antibody (middle and bottom, pAkt and Akt). The immunostainings were densitometrically measured, and the relative ratio of pAkt/Akt was plotted for each treatment (right): Endo-N(−) (filled squares), Endo-N(+) (filled circles), and bEndo-N(+) (filled triangles). The pAkt/Akt value at 0 min was set to 1.0. The data are expressed as the mean ± S.D. (error bars), with at least 3 replicates/experiment. ** and *, p < 0.01 and p < 0.1, respectively, compared with the case with Endo-N(−).

