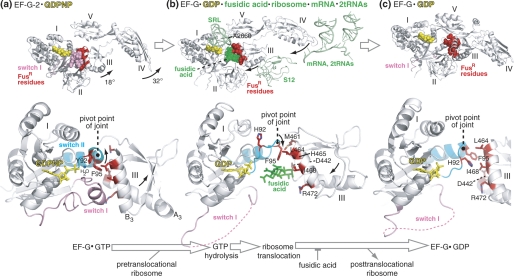
FIGURE 8.
Mechanism for how conserved FusR residues at the interface between domains I and III of EF-G control GTP hydrolysis, ribosome translocation, and EF-G release from the ribosome. This figure highlights the FusR residues in the context of three previously published crystal structures of EF-G proteins in different functional states. a, EF-G-2·GDPNP (25); b, ribosome-bound EF-G·GDP·fusidic acid (11); c, FusR EF-G(T84A)·GDP (27). Shown in the upper row are the overviews of the three EF-G structures, along with selected ribosomal components and fusidic acid (highlighted in green in b). The middle row shows a close-up view of domains I and III of EF-G of the three structures, with the side chains of the FusR residues highlighted in red. The lower row shows the reaction scheme of the EF-G catalytic cycle represented by the three EF-G structures separated by large arrows. The small arrows in the EF-G structures indicate the directions of EF-G domain movements during GTP hydrolysis and ribosome translocation. The pivot point of the joint between switch II and domain III is also indicated in each of the three structures. The structural schematics are based on Protein Data Bank codes 1WDT, 2WRI, 2WRJ, and 2BM0. All three EF-G structures are from T. thermophilus. Residue numbers refer to E. coli.

